

Question: Topic: Regression Line STATISTICS AND PROBABILITY FOURTH QUARTER- WEEK& - LESSON 17 using the table : Data show the population of the Plulippines from 2005
Topic: Regression Line
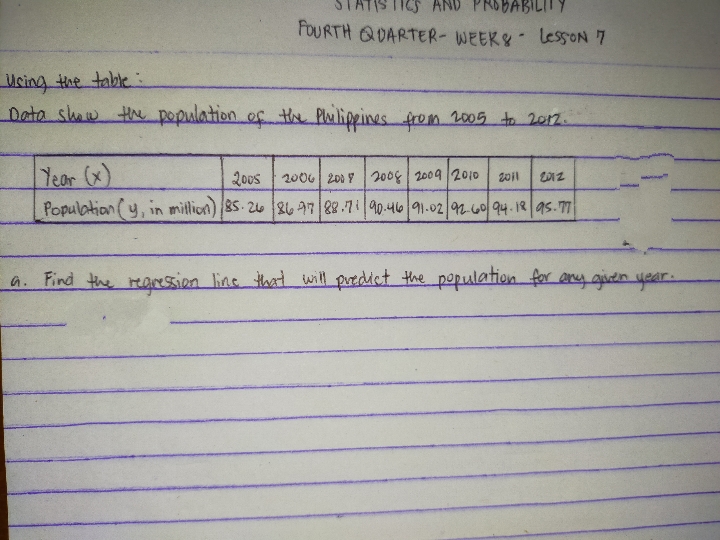

STATISTICS AND PROBABILITY FOURTH QUARTER- WEEK& - LESSON 17 using the table : Data show the population of the Plulippines from 2005 to 2012. Year (x ) 2005 2004 2014 2005 2009 2010 Population ( y, in million) 85. 24 86 47 88. 71 / 90-46 91.02 / 92-60/ 94.18 /95.77 a. Find the regression line that will predict the population for any given year.b. use the regression line to predict the population in 2014. C . Based on the actual data, the population of the country in 2015 is about 100 million . How close your predicted value to the actual value ? d. Draw the scatterplot and sketch the regression line . Show the predicted population in-2014
Step by Step Solution
There are 3 Steps involved in it

Get step-by-step solutions from verified subject matter experts