

Question: (Total 4 points, one point for each) The following table shows the real rate of return on the S&P 500 index from 2000 to 2017.
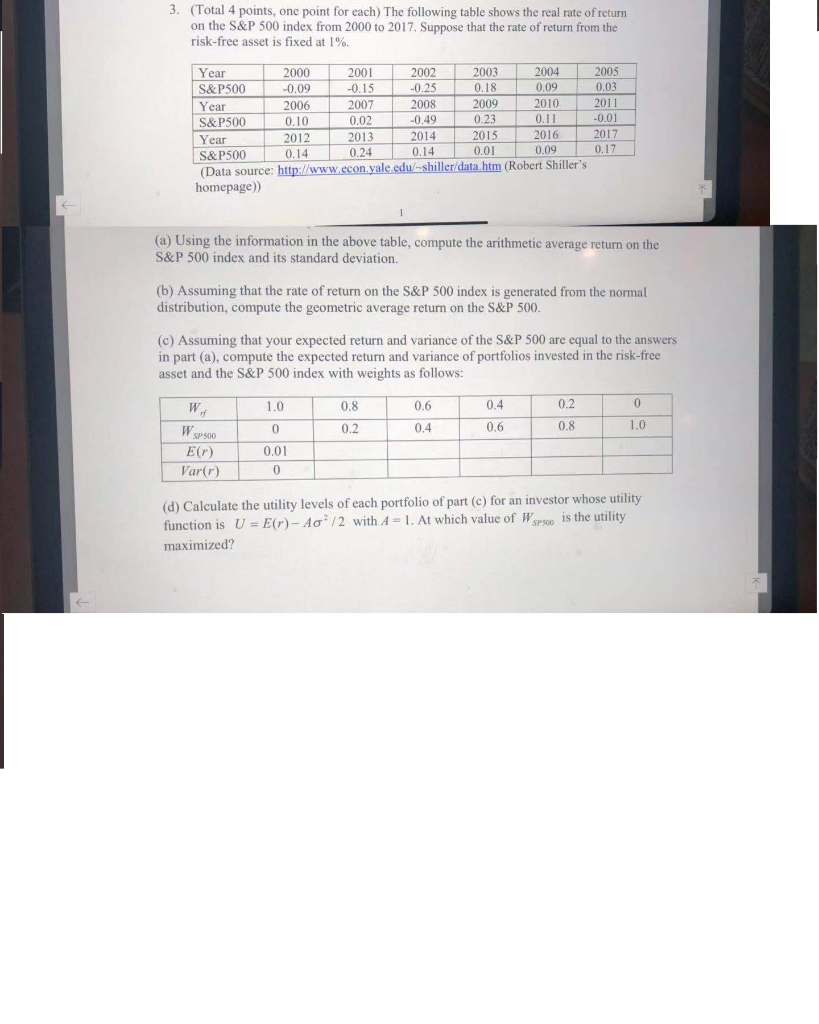
(Total 4 points, one point for each) The following table shows the real rate of return on the S&P 500 index from 2000 to 2017. Suppose that the rate of return from the risk-free asset is fixed at 1% . 3. 2004 0.09 2005 Year S&P500 2000 2001 2002 2003 -0.25 0.03 0.18 -0.09 -0.15 2010 2011 2009 2007 0.02 2008 2006 Year -0.01 S&P500 Year 0.23 0.11 -0.49 0.10 2017 2016 2014 0.14 2015 2012 0.14 2013 0.17 0,01 0,09 0.24 S&P500 (Data source: http://www.econ.yale.edu/-shiller/data.htm (Robert Shiller's homepage) (a) Using the information in the above table, compute the arithmetic average return on the S&P 500 index and its standard deviation. (b) Assuming that the rate of return on the S&P 500 index is generated from the normal distribution, compute the geometric average return on the S&P 500. (c) Assuming that your expected return and variance of the S&P 500 are equal to the answers in part (a), compute the expected return and variance of portfolios invested in the risk-free asset and the S&P 500 index with weights as follows: 0 0.2 0.4 1.0 0.8 0.6 W 1.0 0.8 0.6 0.2 0.4 0 WSP500 E(r) 0.01 0 Var(r) (d) Calculate the utility levels of each portfolio of part (c) for an investor whose utility function is U - E(r)- Ao /2 with A 1. At which value of W is the utility SPS00 maximized
Step by Step Solution
There are 3 Steps involved in it

Get step-by-step solutions from verified subject matter experts