

Question: Total Current Assets Total Assets Total Current Liabilities Total Liabilities Total Equity 20X1 $ 16,403 773,253 59,820 265,988 507,265 20X2 $ 17,800 763,150 45,500 190,500
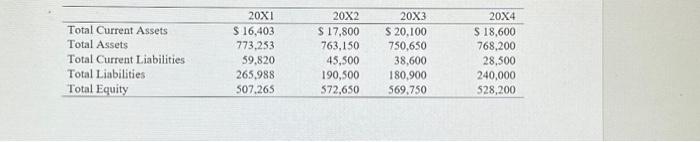
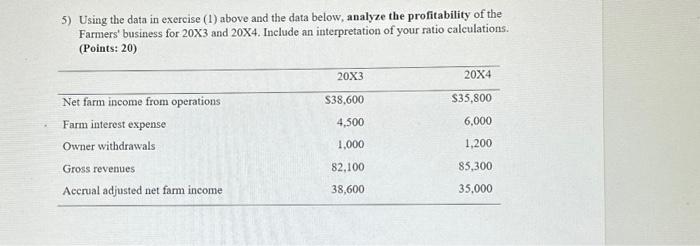
\begin{tabular}{lrrrr} \hline & 20X1 & 20X2 & 20X3 & 20X4 \\ \hline Total Current Assets & $16,403 & $17,800 & $20,100 & $18,600 \\ Total Assets & 773,253 & 763,150 & 750,650 & 768,200 \\ Total Current Liabilities & 59,820 & 45,500 & 38,600 & 28,500 \\ Total Liabilities & 265,988 & 190,500 & 180,900 & 240,000 \\ Total Equity & 507,265 & 572,650 & 569,750 & 528,200 \\ \hline \end{tabular} 5) Using the data in exercise (1) above and the data below, analyze the profitability of the Farmers' business for 203 and 204. Include an interpretation of your ratio calculations. (Points: 20) \begin{tabular}{lrrrr} \hline & 20X1 & 20X2 & 20X3 & 20X4 \\ \hline Total Current Assets & $16,403 & $17,800 & $20,100 & $18,600 \\ Total Assets & 773,253 & 763,150 & 750,650 & 768,200 \\ Total Current Liabilities & 59,820 & 45,500 & 38,600 & 28,500 \\ Total Liabilities & 265,988 & 190,500 & 180,900 & 240,000 \\ Total Equity & 507,265 & 572,650 & 569,750 & 528,200 \\ \hline \end{tabular} 5) Using the data in exercise (1) above and the data below, analyze the profitability of the Farmers' business for 203 and 204. Include an interpretation of your ratio calculations. (Points: 20)
Step by Step Solution
There are 3 Steps involved in it

Get step-by-step solutions from verified subject matter experts