

Question: Total Current Assets Total Current Liabilities 2019 2018 $ 410,000 $ 300,000 $ 195,000 150,000 2017 250,000 125,000 Print Done First, calculate the amount and

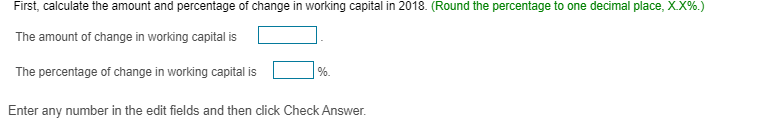
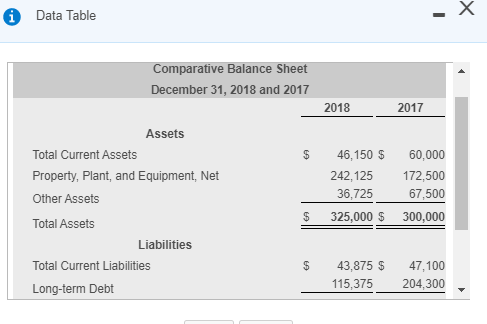
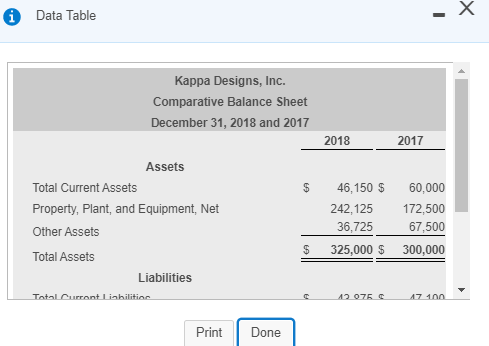
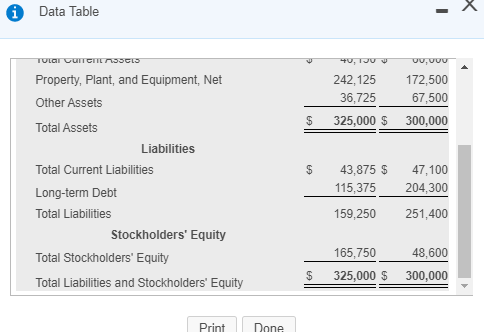


Total Current Assets Total Current Liabilities 2019 2018 $ 410,000 $ 300,000 $ 195,000 150,000 2017 250,000 125,000 Print Done First, calculate the amount and percentage of change in working capital in 2018. (Round the percentage to one decimal place, XX%.) The amount of change in working capital is The percentage of change in working capital is % Enter any number in the edit fields and then click Check Answer. * Data Table Comparative Balance Sheet December 31, 2018 and 2017 2018 2017 $ Assets Total Current Assets Property, Plant, and Equipment, Net Other Assets 46,150 $ 242,125 36,725 325,000 $ 60,000 172,500 67,500 300,000 $ Total Assets Liabilities $ Total Current Liabilities Long-term Debt 43,875 $ 115,375 47,100 204,300 Data Table Kappa Designs, Inc. Comparative Balance Sheet December 31, 2018 and 2017 2018 2017 $ Assets Total Current Assets Property, Plant, and Equipment, Net Other Assets 46,150 $ 242,125 36,725 325,000 $ 60,000 172,500 67,500 300,000 Total Assets Liabilities Total Curront libilitia 120757 .100 Print Done Data Table TULOT UITGESCIS 40, JUU , 242,125 172,500 36,725 67,500 325,000 $ 300,000 $ $ Property, Plant, and Equipment, Net Other Assets Total Assets Liabilities Total Current Liabilities Long-term Debt Total Liabilities Stockholders' Equity Total Stockholders' Equity Total Liabilities and Stockholders' Equity 43,875 $ 115,375 159,250 47,100 204,300 251,400 165,750 325,000 $ 48,600 300,000 $ Print Done Kappa Designs, Inc. has the following data: Click the icon to view the data.) Perform a vertical analysis of Kappa Designs' balance sheet for each year. Kappa Designs, Inc. has the following data: Click the icon to view the data.) Perform a vertical analysis of Kappa Designs' balance sheet for each year
Step by Step Solution
There are 3 Steps involved in it

Get step-by-step solutions from verified subject matter experts