

Question: Total Selling price Variable expenses Contribution margin Total fixed expenses No. of units sold to breakeven No. of units expected to be sold Product Y
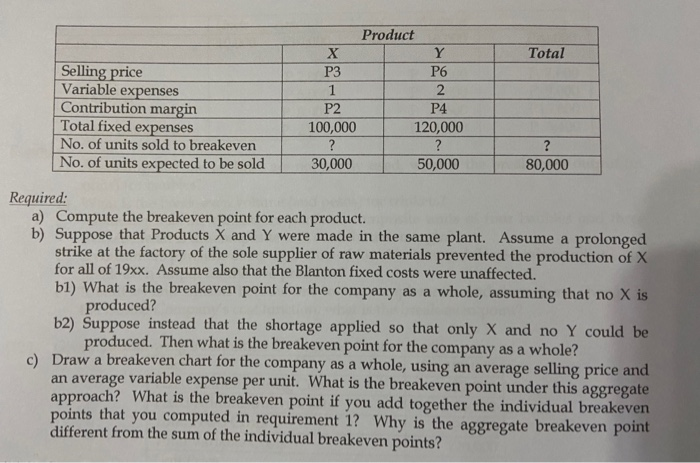
Total Selling price Variable expenses Contribution margin Total fixed expenses No. of units sold to breakeven No. of units expected to be sold Product Y P3 P6 1 2 P2 P4 100,000 120,000 ? ? ? 30,000 50,000 80,000 Required: a) Compute the breakeven point for each product. b) Suppose that Products X and Y were made in the same plant. Assume a prolonged strike at the factory of the sole supplier of raw materials prevented the production of X for all of 19xx. Assume also that the Blanton fixed costs were unaffected. bl) What is the breakeven point for the company as a whole, assuming that no X is produced? b2) Suppose instead that the shortage applied so that only X and no Y could be produced. Then what is the breakeven point for the company as a whole? c) Draw a breakeven chart for the company as a whole, using an average selling price and an average variable expense per unit. What is the breakeven point under this aggregate approach? What is the breakeven point if you add together the individual breakeven points that you computed in requirement 1? Why is the aggregate breakeven point different from the sum of the individual breakeven points
Step by Step Solution
There are 3 Steps involved in it

Get step-by-step solutions from verified subject matter experts