

Question: Tournament Sporting Goods ($ in thousands) Two: You MU Repeat Git 2009 2010 2011 2012 2013 2014 Three: A few Sales 477.84 491.62 706.52 792.01

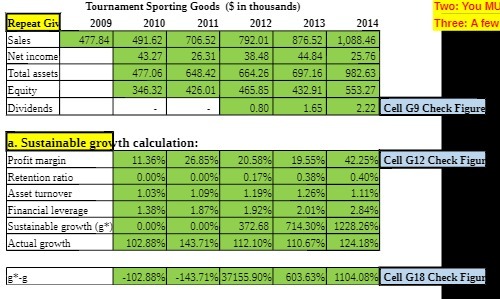
Tournament Sporting Goods ($ in thousands) Two: You MU Repeat Git 2009 2010 2011 2012 2013 2014 Three: A few Sales 477.84 491.62 706.52 792.01 876.52 1,068.46 Net income 43.27 26.31 38.48 44 84 25.76 Total assets 477.06 648.42 564.26 697.16 982.63 Equity 346.32 426.01 465.85 432.91 553.27 Dividends 0.80 1.65 2.22 Cell G9 Check Figure a. Sustainable growth calculation: Profit margin 11.36% 26.85% 20.589% 19.55% 42.259% Cell G12 Check Figun Retention ratio 0.00% 0.009% 0.179% 0.389% 0.409% Asset turnover 1.03% 1 09% 1.199% 1.26% 1.11% Financial leverage 1.38% 1 87% 1.929% 2.019% 2.84% Sustainable growth (* 0.00% 0.00% 372.68 714.30% 1228.26% Actual growth 102.88% 143.71% 112.10% 110.67% 124.18% -102.889% -143.71% 37155.909% 603.63% 1104.089% Cell G18 Check Figur
Step by Step Solution
There are 3 Steps involved in it

Get step-by-step solutions from verified subject matter experts