

Question: Transaction Price P 200 NOTE: CREATE A FREQUENCY DISTRIBUTION USING: 435 6 BINS / INTERVALS 265 BIN WIDTH OF 100 UIAWN 300 S (less than
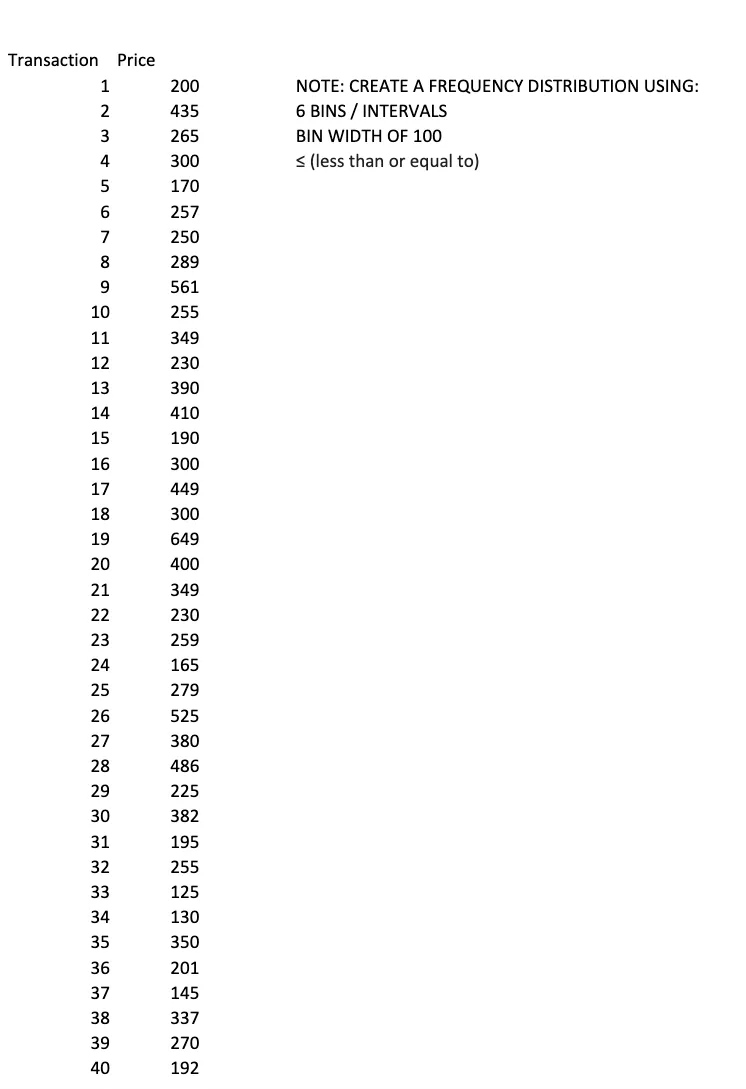
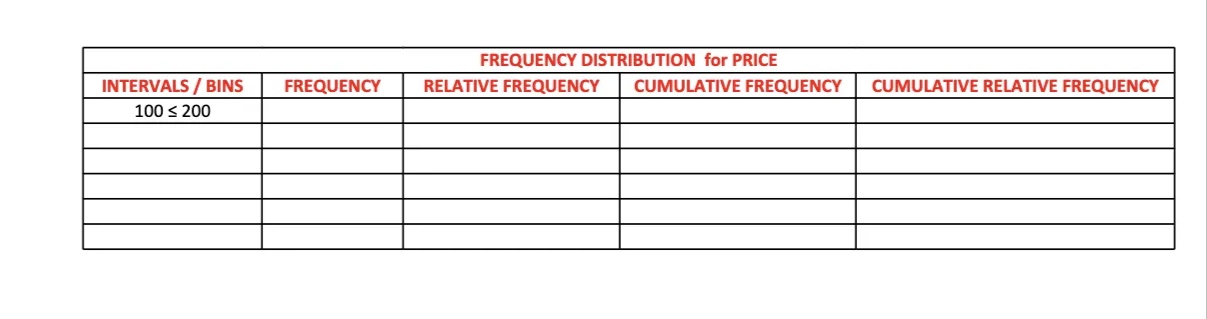
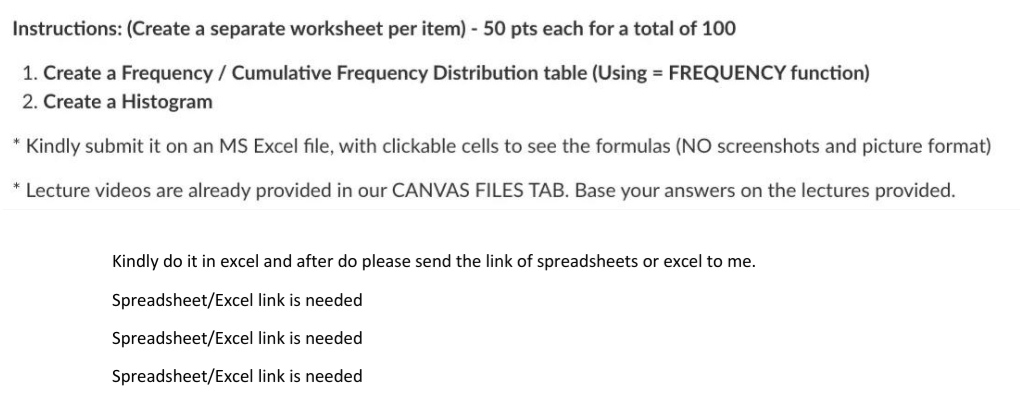
Transaction Price P 200 NOTE: CREATE A FREQUENCY DISTRIBUTION USING: 435 6 BINS / INTERVALS 265 BIN WIDTH OF 100 UIAWN 300 S (less than or equal to) 170 257 250 8 289 9 561 10 255 11 349 12 230 13 390 14 410 15 190 16 300 17 449 18 300 19 649 20 400 21 349 22 230 23 259 24 165 25 279 26 525 27 380 28 486 29 225 30 382 31 195 32 255 33 125 34 130 35 350 36 201 37 145 38 337 39 270 40 192FREQUENCY DISTRIBUTION for PRICE INTERVALS / BINS FREQUENCY RELATIVE FREQUENCY CUMULATIVE FREQUENCY CUMULATIVE RELATIVE FREQUENCY 100 s 200Instructions: (Create a separate worksheet per item) - 50 pts each for a total of 100 1. Create a Frequency / Cumulative Frequency Distribution table (Using = FREQUENCY function) 2. Create a Histogram * Kindly submit it on an MS Excel file, with clickable cells to see the formulas (NO screenshots and picture format) * Lecture videos are already provided in our CANVAS FILES TAB. Base your answers on the lectures provided. Kindly do it in excel and after do please send the link of spreadsheets or excel to me. Spreadsheet/Excel link is needed Spreadsheet/Excel link is needed Spreadsheet/Excel link is needed
Step by Step Solution
There are 3 Steps involved in it

Get step-by-step solutions from verified subject matter experts