

Question: transactions for each year are color coded. use the horizontal transaction analysis balance and the details from the transactions each year to creaye the following
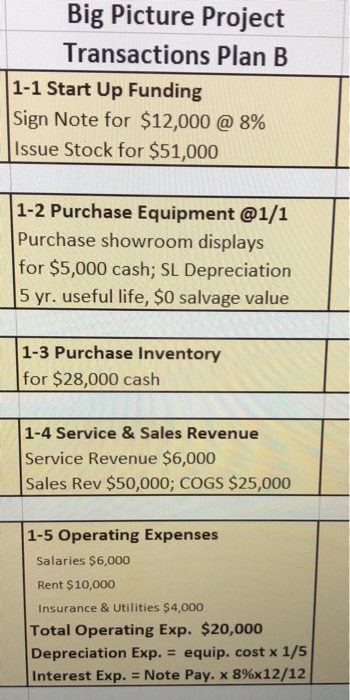
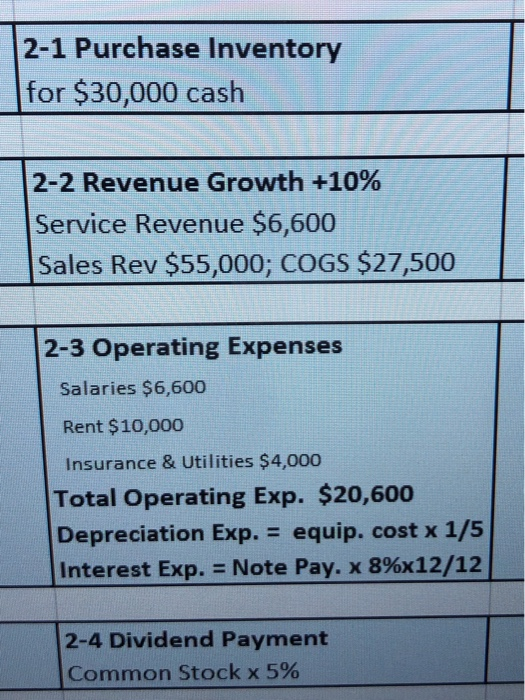
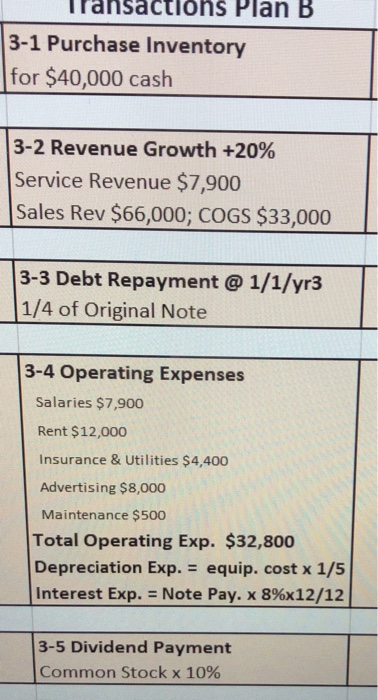
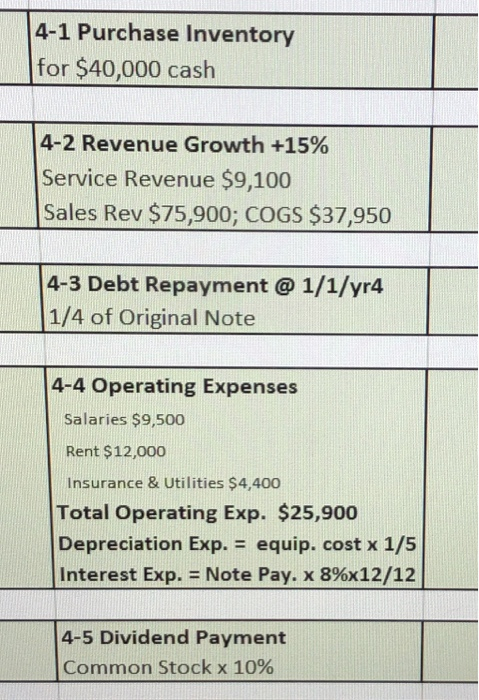
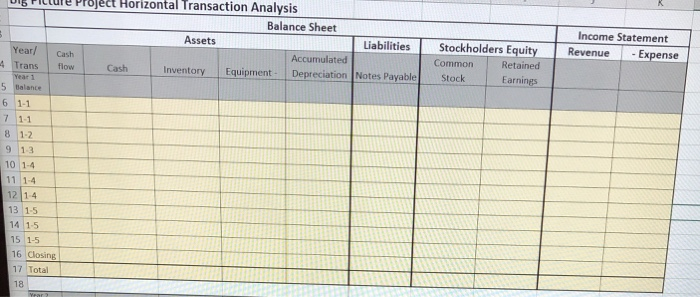
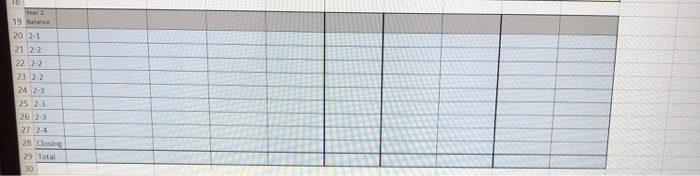
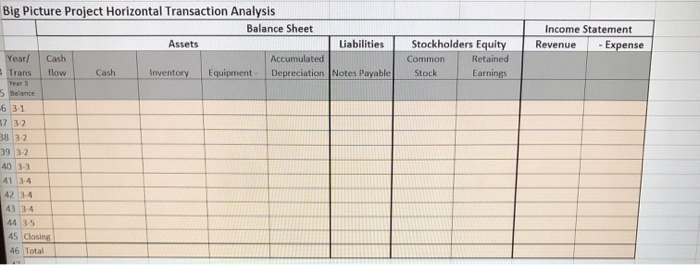
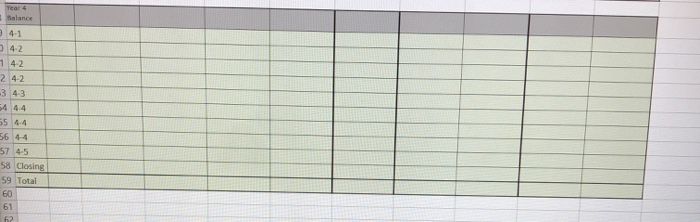
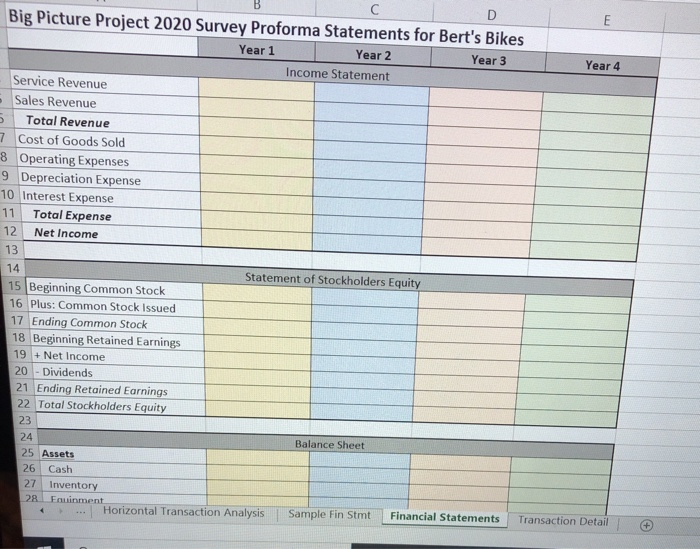
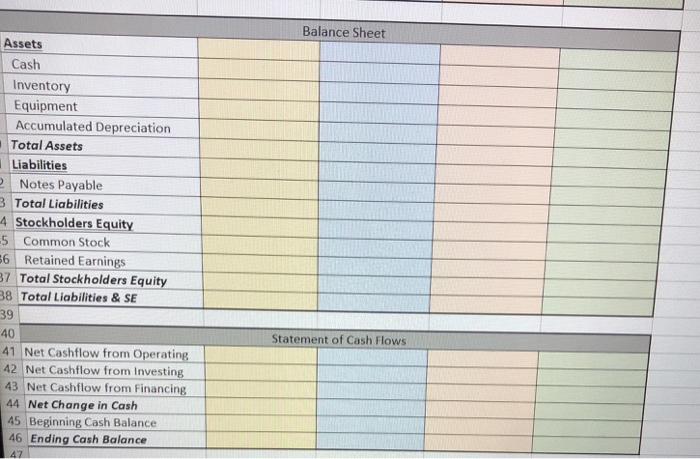
Big Picture Project Transactions Plan B 1-1 Start Up Funding Sign Note for $12,000 @ 8% Issue Stock for $51,000 1-2 Purchase Equipment @1/1 Purchase showroom displays for $5,000 cash; SL Depreciation 5 yr. useful life, $0 salvage value 1-3 Purchase Inventory for $28,000 cash 1-4 Service & Sales Revenue Service Revenue $6,000 Sales Rev $50,000; COGS $25,000 1-5 Operating Expenses Salaries $6,000 Rent $10,000 Insurance & Utilities $4,000 Total Operating Exp. $20,000 Depreciation Exp. = equip. cost x 1/5 Interest Exp. = Note Pay. x 8%x12/12 2-1 Purchase Inventory for $30,000 cash 2-2 Revenue Growth +10% Service Revenue $6,600 Sales Rev $55,000; COGS $27,500 2-3 Operating Expenses Salaries $6,600 Rent $10,000 Insurance & Utilities $4,000 Total Operating Exp. $20,600 Depreciation Exp. = equip. cost x 1/5 Interest Exp. = Note Pay. x 8%x12/12 2-4 Dividend Payment Common Stock x 5% ansactions Plan B 3-1 Purchase Inventory for $40,000 cash 3-2 Revenue Growth +20% Service Revenue $7,900 Sales Rev $66,000; COGS $33,000 3-3 Debt Repayment @ 1/1/yr3 1/4 of Original Note 3-4 Operating Expenses Salaries $7,900 Rent $12,000 Insurance & Utilities $4,400 Advertising $8,000 Maintenance $500 Total Operating Exp. $32,800 Depreciation Exp. = equip. cost x 1/5 Interest Exp. = Note Pay. x 8%x12/12 3-5 Dividend Payment Common Stock x 10% 4-1 Purchase Inventory for $40,000 cash 4-2 Revenue Growth +15% Service Revenue $9,100 Sales Rev $75,900; COGS $37,950 4-3 Debt Repayment @ 1/1/yr4 1/4 of Original Note 4-4 Operating Expenses Salaries $9,500 Rent $12,000 Insurance & Utilities $4,400 Total Operating Exp. $25,900 Depreciation Exp. = equip. cost x 1/5 Interest Exp. = Note Pay. x 8%x12/12 4-5 Dividend Payment Common Stock x 10% Income Statement Revenue - Expense Stockholders Equity Common Retained Stock Earnings Project Horizontal Transaction Analysis Balance Sheet Assets Liabilities Year! Cash Accumulated 4 Trans flow Cash Inventory Equipment Depreciation Notes Payable Year 1 5 Balance 6 1-1 7 1-1 8 1-2 913 10 1-4 11 1-4 121-4 13 1-5 14 1-5 15 1-5 16 Closing 17 Total 18 Year 18 Yout 19 Balance 20 21 21 2-2 22 2-2 23 2.2 24 2-3 25 2-3 26 2-3 27 2-4 28 Closing 29 Total 30 Income Statement Revenue - Expense Stockholders Equity Common Retained Stock Earnings Big Picture Project Horizontal Transaction Analysis Balance Sheet Assets Liabilities Year! Cash Accumulated Trans flow Cash Inventory Equipment Depreciation Notes Payable Year 5 Balance 6 31 37 3-2 38 3 2 39 3-2 40 3-3 42 34 43 34 44 35 45 Closing 46 Total Year 4 Balance 4-1 3 4.2 7 42 2 4.2 3 43 55 4.4 56 44 157 45 58 Closing 59 Total 60 61 2 5 B D E Big Picture Project 2020 Survey Proforma Statements for Bert's Bikes Year 1 Year 2 Year 3 Year 4 Income Statement Service Revenue Sales Revenue Total Revenue 7 Cost of Goods Sold 8 Operating Expenses 9 Depreciation Expense 10 Interest Expense 11 Total Expense 12 Net Income 13 14 Statement of Stockholders Equity 15 Beginning Common Stock 16 Plus: Common Stock Issued 17 Ending Common Stock 18 Beginning Retained Earnings 19 + Net Income 20 - Dividends 21 Ending Retained Earnings 22 Total Stockholders Equity 23 24 Balance Sheet 25 Assets 26 Cash 27 Inventory 28 Fruinment Horizontal Transaction Analysis Sample Fin Stmt Financial Statements Transaction Detail Balance Sheet Assets Cash Inventory Equipment Accumulated Depreciation Total Assets Liabilities Notes Payable 3 Total Liabilities 4 Stockholders Equity -5 Common Stock 56 Retained Earnings 37 Total Stockholders Equity 38 Total Liabilities & SE 39 40 41 Net Cashflow from Operating 42 Net Cashflow from Investing 43 Net Cashflow from Financing 44 Net Change in Cash 45 Beginning Cash Balance 46 Ending Cash Balance Statement of Cash Flows A7 Big Picture Project Transactions Plan B 1-1 Start Up Funding Sign Note for $12,000 @ 8% Issue Stock for $51,000 1-2 Purchase Equipment @1/1 Purchase showroom displays for $5,000 cash; SL Depreciation 5 yr. useful life, $0 salvage value 1-3 Purchase Inventory for $28,000 cash 1-4 Service & Sales Revenue Service Revenue $6,000 Sales Rev $50,000; COGS $25,000 1-5 Operating Expenses Salaries $6,000 Rent $10,000 Insurance & Utilities $4,000 Total Operating Exp. $20,000 Depreciation Exp. = equip. cost x 1/5 Interest Exp. = Note Pay. x 8%x12/12 2-1 Purchase Inventory for $30,000 cash 2-2 Revenue Growth +10% Service Revenue $6,600 Sales Rev $55,000; COGS $27,500 2-3 Operating Expenses Salaries $6,600 Rent $10,000 Insurance & Utilities $4,000 Total Operating Exp. $20,600 Depreciation Exp. = equip. cost x 1/5 Interest Exp. = Note Pay. x 8%x12/12 2-4 Dividend Payment Common Stock x 5% ansactions Plan B 3-1 Purchase Inventory for $40,000 cash 3-2 Revenue Growth +20% Service Revenue $7,900 Sales Rev $66,000; COGS $33,000 3-3 Debt Repayment @ 1/1/yr3 1/4 of Original Note 3-4 Operating Expenses Salaries $7,900 Rent $12,000 Insurance & Utilities $4,400 Advertising $8,000 Maintenance $500 Total Operating Exp. $32,800 Depreciation Exp. = equip. cost x 1/5 Interest Exp. = Note Pay. x 8%x12/12 3-5 Dividend Payment Common Stock x 10% 4-1 Purchase Inventory for $40,000 cash 4-2 Revenue Growth +15% Service Revenue $9,100 Sales Rev $75,900; COGS $37,950 4-3 Debt Repayment @ 1/1/yr4 1/4 of Original Note 4-4 Operating Expenses Salaries $9,500 Rent $12,000 Insurance & Utilities $4,400 Total Operating Exp. $25,900 Depreciation Exp. = equip. cost x 1/5 Interest Exp. = Note Pay. x 8%x12/12 4-5 Dividend Payment Common Stock x 10% Income Statement Revenue - Expense Stockholders Equity Common Retained Stock Earnings Project Horizontal Transaction Analysis Balance Sheet Assets Liabilities Year! Cash Accumulated 4 Trans flow Cash Inventory Equipment Depreciation Notes Payable Year 1 5 Balance 6 1-1 7 1-1 8 1-2 913 10 1-4 11 1-4 121-4 13 1-5 14 1-5 15 1-5 16 Closing 17 Total 18 Year 18 Yout 19 Balance 20 21 21 2-2 22 2-2 23 2.2 24 2-3 25 2-3 26 2-3 27 2-4 28 Closing 29 Total 30 Income Statement Revenue - Expense Stockholders Equity Common Retained Stock Earnings Big Picture Project Horizontal Transaction Analysis Balance Sheet Assets Liabilities Year! Cash Accumulated Trans flow Cash Inventory Equipment Depreciation Notes Payable Year 5 Balance 6 31 37 3-2 38 3 2 39 3-2 40 3-3 42 34 43 34 44 35 45 Closing 46 Total Year 4 Balance 4-1 3 4.2 7 42 2 4.2 3 43 55 4.4 56 44 157 45 58 Closing 59 Total 60 61 2 5 B D E Big Picture Project 2020 Survey Proforma Statements for Bert's Bikes Year 1 Year 2 Year 3 Year 4 Income Statement Service Revenue Sales Revenue Total Revenue 7 Cost of Goods Sold 8 Operating Expenses 9 Depreciation Expense 10 Interest Expense 11 Total Expense 12 Net Income 13 14 Statement of Stockholders Equity 15 Beginning Common Stock 16 Plus: Common Stock Issued 17 Ending Common Stock 18 Beginning Retained Earnings 19 + Net Income 20 - Dividends 21 Ending Retained Earnings 22 Total Stockholders Equity 23 24 Balance Sheet 25 Assets 26 Cash 27 Inventory 28 Fruinment Horizontal Transaction Analysis Sample Fin Stmt Financial Statements Transaction Detail Balance Sheet Assets Cash Inventory Equipment Accumulated Depreciation Total Assets Liabilities Notes Payable 3 Total Liabilities 4 Stockholders Equity -5 Common Stock 56 Retained Earnings 37 Total Stockholders Equity 38 Total Liabilities & SE 39 40 41 Net Cashflow from Operating 42 Net Cashflow from Investing 43 Net Cashflow from Financing 44 Net Change in Cash 45 Beginning Cash Balance 46 Ending Cash Balance Statement of Cash Flows A7
Step by Step Solution
There are 3 Steps involved in it

Get step-by-step solutions from verified subject matter experts