

Question: 1. Read the case details carefully. 2. Complete the pro forma statements (IS and BS) and valuation in the shaded cells in tabs 1-4. 3.
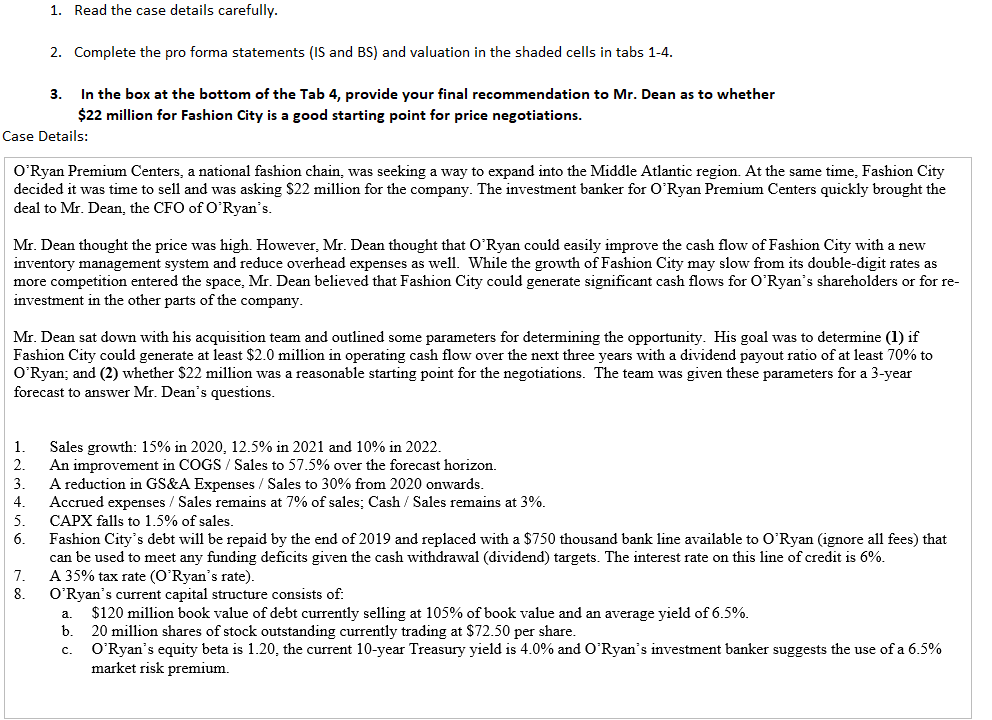
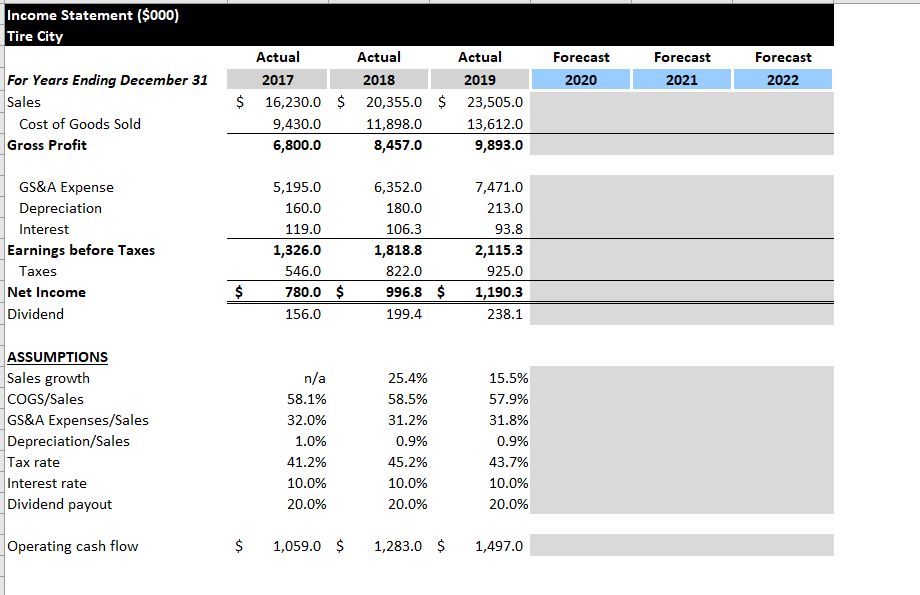

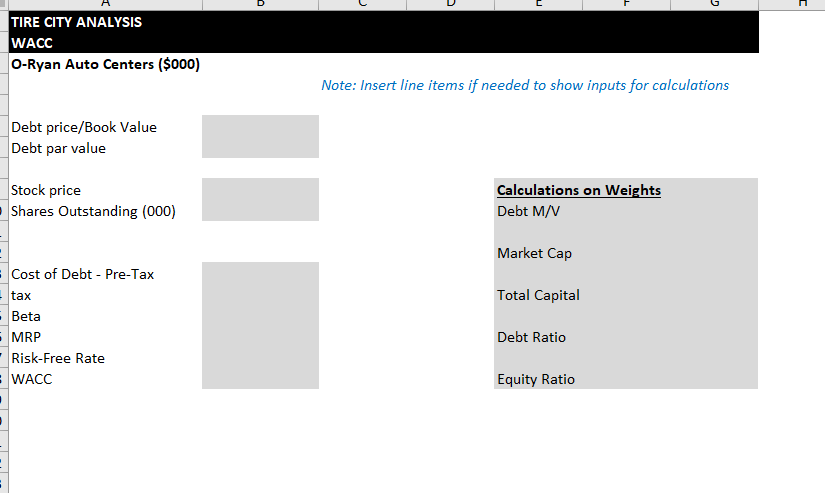
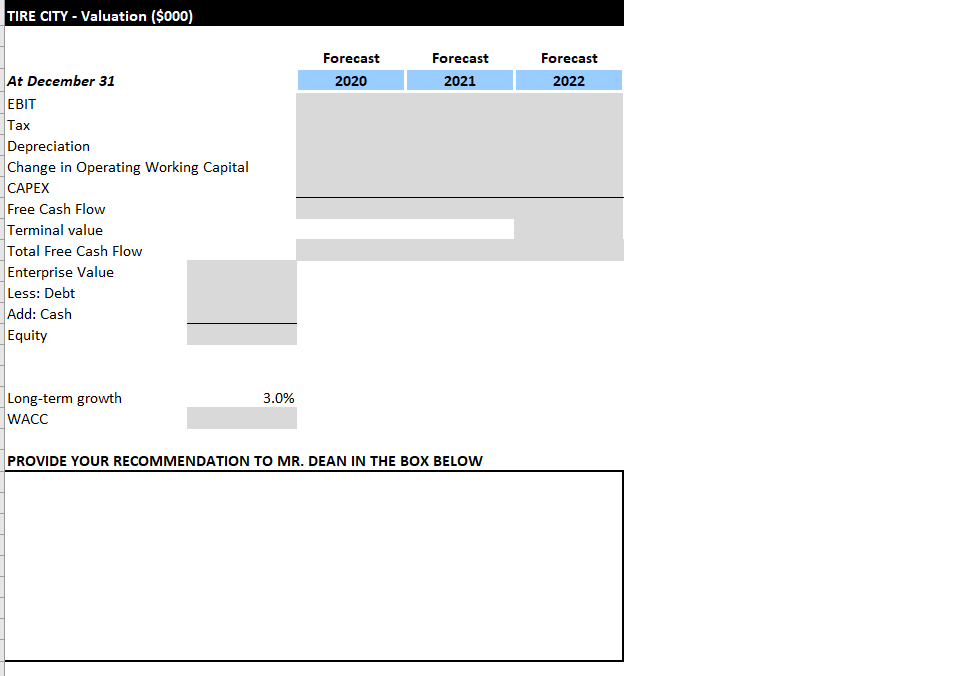
1. Read the case details carefully. 2. Complete the pro forma statements (IS and BS) and valuation in the shaded cells in tabs 1-4. 3. In the box at the bottom of the Tab 4, provide your final recommendation to Mr. Dean as to whether $22 million for Fashion City is a good starting point for price negotiations. Case Details: O'Ryan Premium Centers, a national fashion chain, was seeking a way to expand into the Middle Atlantic region. At the same time, Fashion City decided it was time to sell and was asking $22 million for the company. The investment banker for O'Ryan Premium Centers quickly brought the deal to Mr. Dean, the CFO of O'Ryan's. Mr. Dean thought the price was high. However, Mr. Dean thought that O'Ryan could easily improve the cash flow of Fashion City with a new inventory management system and reduce overhead expenses as well. While the growth of Fashion City may slow from its double-digit rates as more competition entered the space. Mr. Dean believed that Fashion City could generate significant cash flows for O'Ryan's shareholders or for re- investment in the other parts of the company. Mr. Dean sat down with his acquisition team and outlined some parameters for determining the opportunity. His goal was to determine (1) if Fashion City could generate at least $2.0 million in operating cash flow over the next three years with a dividend payout ratio of at least 70% to O'Ryan; and (2) whether $22 million was reasonable starting point for the negotiations. The team was given these parameters for a 3-year forecast to answer Mr. Dean's questions. 1. 2. 4. 5. 6. Sales growth: 15% in 2020, 12.5% in 2021 and 10% in 2022. An improvement in COGS / Sales to 57.5% over the forecast horizon. A reduction in GS&A Expenses / Sales to 30% from 2020 onwards. Accrued expenses / Sales remains at 7% of sales: Cash/ Sales remains at 3%. CAPX falls to 1.5% of sales. Fashion City's debt will be repaid by the end of 2019 and replaced with a $750 thousand bank line available to O'Ryan (ignore all fees) that can be used to meet any funding deficits given the cash withdrawal (dividend) targets. The interest rate on this line of credit is 6%. A 35% tax rate (O'Ryan's rate). O'Ryan's current capital structure consists of: $120 million book value of debt currently selling at 105% of book value and an average yield of 6.5%. b. 20 million shares of stock outstanding currently trading at $72.50 per share. O'Ryan's equity beta is 1.20. the current 10-year Treasury yield is 4.0% and O'Ryan's investment banker suggests the use of a 6.5% market risk premium. 7. 8. a. C. Income Statement ($000) Tire City Forecast Forecast 2020 Forecast 2021 2022 For Years Ending December 31 Sales Cost of Goods Sold Gross Profit Actual Actual Actual 2017 2018 2019 $ 16,230.0 $ 20,355.0 $ 23,505.0 9,430.0 11,898.0 13,612.0 6,800.0 8,457.0 9,893.0 GS&A Expense Depreciation Interest Earnings before Taxes Taxes Net Income Dividend 5,195.0 160.0 119.0 1,326.0 546.0 780.0 $ 156.0 6,352.0 180.0 106.3 1,818.8 822.0 996.8 $ 199.4 7,471.0 213.0 93.8 2,115.3 925.0 1,190.3 238.1 $ ASSUMPTIONS Sales growth COGS/Sales GS&A Expenses/Sales Depreciation/Sales Tax rate Interest rate Dividend payout n/a 58.1% 32.0% 1.0% 41.2% 10.0% 20.0% 25.4% 58.5% 31.2% 0.9% 45.2% 10.0% 20.0% 15.5% 57.9% 31.8% 0.9% 43.7% 10.0% 20.0% Operating cash flow $ 1,059.0 $ 1,283.0 $ 1,497.0 2017 2018 2019 2020 2021 2022 $ $ At December 31 Assets Cash Accounts Receivable Inventories Current Assets 508.0 $ 2,545.0 1,630.0 4,683.0 609.0 3,095.0 1,838.0 5,542.0 706.0 3,652.0 2,190.0 6,548.0 4,073.1 2,321.7 4,582.3 2,611.9 5,040.5 2,873.1 Gross PPE Accumulated depreciation Net PPPE 3,232.0 1,335.0 1,897.0 3,795.0 1,515.0 2,280.0 4,163.0 1,728.0 2,435.0 4,568.5 1,998.3 2,570.2 5,024.6 2,302.4 2,722.2 5,526.4 2,636.9 2,889.5 Total Assets $ 6,580.0 $ 7,822.0 $ 8,983.0 $ $ $ USE "Goal Seek" function Liabilities & Shareholders Equity Bank debt Current Portion of Long-term Debt Accounts Payable Accrued expenses Current Liabilities 1,688.5 1,899.6 2,089.5 125.0 1,042.0 1,145.0 2,312.0 125.0 1,325.0 1,432.0 2,882.0 125.0 1,437.0 1,653.0 3,215.0 Long-Term Debt 1,000.0 875.0 750.0 Common stock Retained earnings Shareholders Equity 1,135.0 2,133.0 3,268.0 1,135.0 2,930.4 4,065.4 1,135.0 3,882.6 5,017.6 Total Liabilities & Shareholders Equity $ 6,580.0 $ 7,822.4 $ 8,982.6 3.1% 7.1% 1,988.0 Cash/Sales Accrued expenses/sales Operating Working Capital Change in NWC CAPEX/ sales CAPEX 3.0% 7.0% 2,176.0 (188.0) 2.8% 563.0 $ 3.0% 7.0% 2,752.0 (576.0) 1.6% 368.0 n/a n/a n/a $ D TIRE CITY ANALYSIS WACC O-Ryan Auto Centers ($000) Note: Insert line items if needed to show inputs for calculations Debt price/Book Value Debt par value Stock price Shares Outstanding (000) Calculations on Weights Debt M/V Market Cap Total Capital Cost of Debt - Pre-Tax tax Beta MRP Risk-Free Rate WACC Debt Ratio Equity Ratio TIRE CITY - Valuation (5000) Forecast 2020 Forecast 2021 Forecast 2022 At December 31 EBIT Tax Depreciation Change in Operating Working Capital CAPEX Free Cash Flow Terminal value Total Free Cash Flow Enterprise Value Less: Debt Add: Cash Equity 3.0% Long-term growth WACC PROVIDE YOUR RECOMMENDATION TO MR. DEAN IN THE BOX BELOW 1. Read the case details carefully. 2. Complete the pro forma statements (IS and BS) and valuation in the shaded cells in tabs 1-4. 3. In the box at the bottom of the Tab 4, provide your final recommendation to Mr. Dean as to whether $22 million for Fashion City is a good starting point for price negotiations. Case Details: O'Ryan Premium Centers, a national fashion chain, was seeking a way to expand into the Middle Atlantic region. At the same time, Fashion City decided it was time to sell and was asking $22 million for the company. The investment banker for O'Ryan Premium Centers quickly brought the deal to Mr. Dean, the CFO of O'Ryan's. Mr. Dean thought the price was high. However, Mr. Dean thought that O'Ryan could easily improve the cash flow of Fashion City with a new inventory management system and reduce overhead expenses as well. While the growth of Fashion City may slow from its double-digit rates as more competition entered the space. Mr. Dean believed that Fashion City could generate significant cash flows for O'Ryan's shareholders or for re- investment in the other parts of the company. Mr. Dean sat down with his acquisition team and outlined some parameters for determining the opportunity. His goal was to determine (1) if Fashion City could generate at least $2.0 million in operating cash flow over the next three years with a dividend payout ratio of at least 70% to O'Ryan; and (2) whether $22 million was reasonable starting point for the negotiations. The team was given these parameters for a 3-year forecast to answer Mr. Dean's questions. 1. 2. 4. 5. 6. Sales growth: 15% in 2020, 12.5% in 2021 and 10% in 2022. An improvement in COGS / Sales to 57.5% over the forecast horizon. A reduction in GS&A Expenses / Sales to 30% from 2020 onwards. Accrued expenses / Sales remains at 7% of sales: Cash/ Sales remains at 3%. CAPX falls to 1.5% of sales. Fashion City's debt will be repaid by the end of 2019 and replaced with a $750 thousand bank line available to O'Ryan (ignore all fees) that can be used to meet any funding deficits given the cash withdrawal (dividend) targets. The interest rate on this line of credit is 6%. A 35% tax rate (O'Ryan's rate). O'Ryan's current capital structure consists of: $120 million book value of debt currently selling at 105% of book value and an average yield of 6.5%. b. 20 million shares of stock outstanding currently trading at $72.50 per share. O'Ryan's equity beta is 1.20. the current 10-year Treasury yield is 4.0% and O'Ryan's investment banker suggests the use of a 6.5% market risk premium. 7. 8. a. C. Income Statement ($000) Tire City Forecast Forecast 2020 Forecast 2021 2022 For Years Ending December 31 Sales Cost of Goods Sold Gross Profit Actual Actual Actual 2017 2018 2019 $ 16,230.0 $ 20,355.0 $ 23,505.0 9,430.0 11,898.0 13,612.0 6,800.0 8,457.0 9,893.0 GS&A Expense Depreciation Interest Earnings before Taxes Taxes Net Income Dividend 5,195.0 160.0 119.0 1,326.0 546.0 780.0 $ 156.0 6,352.0 180.0 106.3 1,818.8 822.0 996.8 $ 199.4 7,471.0 213.0 93.8 2,115.3 925.0 1,190.3 238.1 $ ASSUMPTIONS Sales growth COGS/Sales GS&A Expenses/Sales Depreciation/Sales Tax rate Interest rate Dividend payout n/a 58.1% 32.0% 1.0% 41.2% 10.0% 20.0% 25.4% 58.5% 31.2% 0.9% 45.2% 10.0% 20.0% 15.5% 57.9% 31.8% 0.9% 43.7% 10.0% 20.0% Operating cash flow $ 1,059.0 $ 1,283.0 $ 1,497.0 2017 2018 2019 2020 2021 2022 $ $ At December 31 Assets Cash Accounts Receivable Inventories Current Assets 508.0 $ 2,545.0 1,630.0 4,683.0 609.0 3,095.0 1,838.0 5,542.0 706.0 3,652.0 2,190.0 6,548.0 4,073.1 2,321.7 4,582.3 2,611.9 5,040.5 2,873.1 Gross PPE Accumulated depreciation Net PPPE 3,232.0 1,335.0 1,897.0 3,795.0 1,515.0 2,280.0 4,163.0 1,728.0 2,435.0 4,568.5 1,998.3 2,570.2 5,024.6 2,302.4 2,722.2 5,526.4 2,636.9 2,889.5 Total Assets $ 6,580.0 $ 7,822.0 $ 8,983.0 $ $ $ USE "Goal Seek" function Liabilities & Shareholders Equity Bank debt Current Portion of Long-term Debt Accounts Payable Accrued expenses Current Liabilities 1,688.5 1,899.6 2,089.5 125.0 1,042.0 1,145.0 2,312.0 125.0 1,325.0 1,432.0 2,882.0 125.0 1,437.0 1,653.0 3,215.0 Long-Term Debt 1,000.0 875.0 750.0 Common stock Retained earnings Shareholders Equity 1,135.0 2,133.0 3,268.0 1,135.0 2,930.4 4,065.4 1,135.0 3,882.6 5,017.6 Total Liabilities & Shareholders Equity $ 6,580.0 $ 7,822.4 $ 8,982.6 3.1% 7.1% 1,988.0 Cash/Sales Accrued expenses/sales Operating Working Capital Change in NWC CAPEX/ sales CAPEX 3.0% 7.0% 2,176.0 (188.0) 2.8% 563.0 $ 3.0% 7.0% 2,752.0 (576.0) 1.6% 368.0 n/a n/a n/a $ D TIRE CITY ANALYSIS WACC O-Ryan Auto Centers ($000) Note: Insert line items if needed to show inputs for calculations Debt price/Book Value Debt par value Stock price Shares Outstanding (000) Calculations on Weights Debt M/V Market Cap Total Capital Cost of Debt - Pre-Tax tax Beta MRP Risk-Free Rate WACC Debt Ratio Equity Ratio TIRE CITY - Valuation (5000) Forecast 2020 Forecast 2021 Forecast 2022 At December 31 EBIT Tax Depreciation Change in Operating Working Capital CAPEX Free Cash Flow Terminal value Total Free Cash Flow Enterprise Value Less: Debt Add: Cash Equity 3.0% Long-term growth WACC PROVIDE YOUR RECOMMENDATION TO MR. DEAN IN THE BOX BELOW
Step by Step Solution
There are 3 Steps involved in it

Get step-by-step solutions from verified subject matter experts