

Question: 2. This model describes the demand for coffee per week for individuals in a sample Y,= 1l-2*P+0.095*Pli t 3 -2.5 2 r-square = -95, n=17
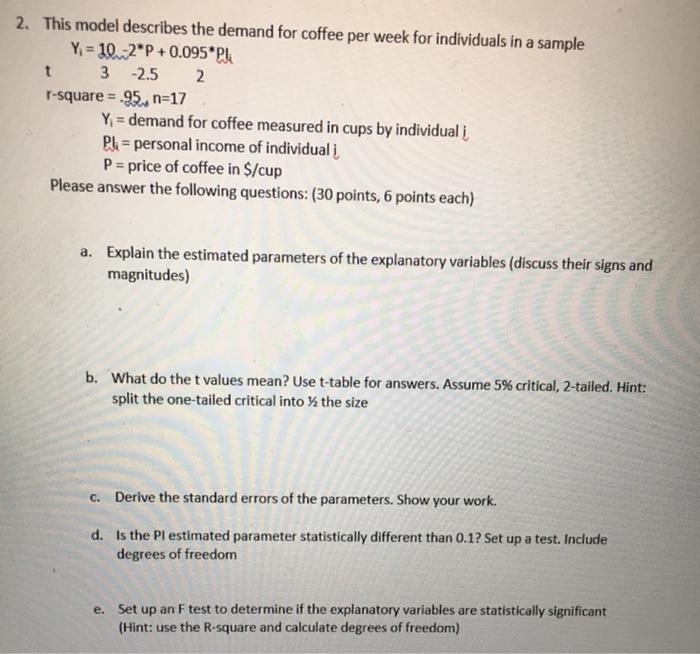
2. This model describes the demand for coffee per week for individuals in a sample Y,= 1l-2*P+0.095*Pli t 3 -2.5 2 r-square = -95, n=17 Y = demand for coffee measured in cups by individual i Pl= personal income of individual P = price of coffee in $/cup Please answer the following questions: (30 points, 6 points each) a. Explain the estimated parameters of the explanatory variables (discuss their signs and magnitudes) b. What do the t values mean? Use t-table for answers. Assume 5% critical, 2-tailed. Hint: split the one-tailed critical into the size C. Derive the standard errors of the parameters. Show your work. d. Is the Pl estimated parameter statistically different than 0.12 Set up a test. Include degrees of freedom e. Set up an F test to determine if the explanatory variables are statistically significant (Hint: use the R-square and calculate degrees of freedom)
Step by Step Solution
There are 3 Steps involved in it

Get step-by-step solutions from verified subject matter experts