

Question: 2-1 Perform a simple regression analysis on the provided peak power data file. Examine and discuss the relationship between: daily high temp ( x-independent variable)
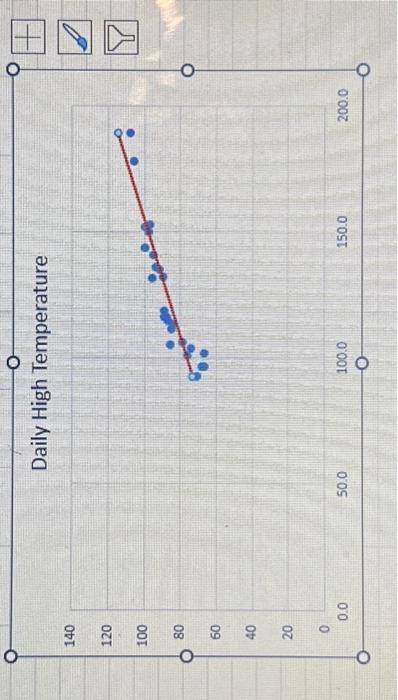
2-1 Perform a simple regression analysis on the provided peak power data file. Examine and discuss the relationship between: daily high temp ( x-independent variable) and peak power load ( y-dependent variable) 2-2 Estimate an appropriate regression equation to predict the peak power load for this power company. Interpret the estimated regression coefficients. 2-3 Analyze the estimated equation's residuals. Do they suggest that the regression equation is adequate? What actions could you take to improve the quality of the model? (Keep in mind that in simple regression you only have two variables - i.v. and d.v. - so, you can't take out any variables as you can in multiple regression. So, you need to examine the scatterplot, look at the spread of the observations, and perhaps decide if removing any observations might be a way to improve things.) 2-4 Use your final equation to predict the peak power load on a summer day with a high temperature of 100 degrees. 2.5 Create a scatterplot for these data. Comment on the observed relationship between X and Y. Daily High Temperature 140 120 100 80 60 40 20 0
Step by Step Solution
There are 3 Steps involved in it

Get step-by-step solutions from verified subject matter experts