

Question: B C D E G K H 8.00 13 Cream 40 $ 0.20 $ 14 15 0.07 1.05 Sugar Vanilla 15 20 0.60 12.00 16
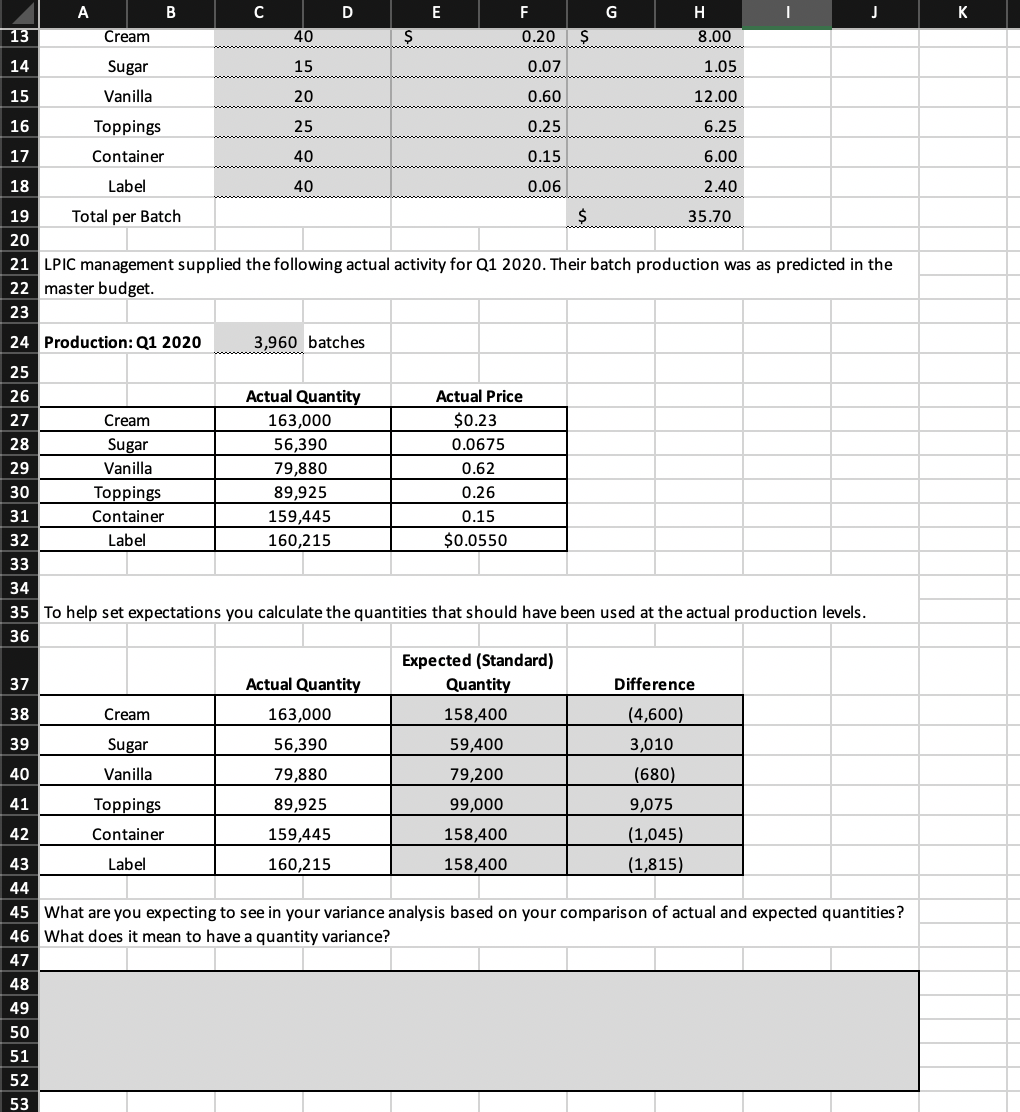
B C D E G K H 8.00 13 Cream 40 $ 0.20 $ 14 15 0.07 1.05 Sugar Vanilla 15 20 0.60 12.00 16 25 0.25 6.25 Toppings Container 17 40 0.15 6.00 18 Label 40 0.06 2.40 19 Total per Batch $ 35.70 20 21 LPIC management supplied the following actual activity for Q1 2020. Their batch production was as predicted in the 22 master budget. 23 24 Production: Q1 2020 3,960 batches 25 26 Actual Quantity Actual Price 27 Cream 163,000 $0.23 28 Sugar 56,390 0.0675 29 Vanilla 79,880 0.62 30 Toppings 89,925 0.26 31 Container 159,445 0.15 32 Label 160,215 $0.0550 33 34 35 To help set expectations you calculate the quantities that should have been used at the actual production levels. 36 Expected (Standard) 37 Actual Quantity Quantity Difference 38 Cream 163,000 158,400 (4,600) 39 Sugar 56,390 59,400 3,010 40 Vanilla 79,880 79,200 (680) 41 Toppings 89,925 99,000 9,075 42 Container 159,445 158,400 (1,045) 43 Label 160,215 158,400 (1,815) 44 45 What are you expecting to see in your variance analysis based on your comparison of actual and expected quantities? 46 What does it mean to have a quantity variance? 47 48 49 50 51 52 53
Step by Step Solution
There are 3 Steps involved in it

Get step-by-step solutions from verified subject matter experts