

Question: begin{tabular}{|c|c|c|} hline & A & B hline 1 & Day & Complaints hline 2 & 1 & 5 hline 3 & 2
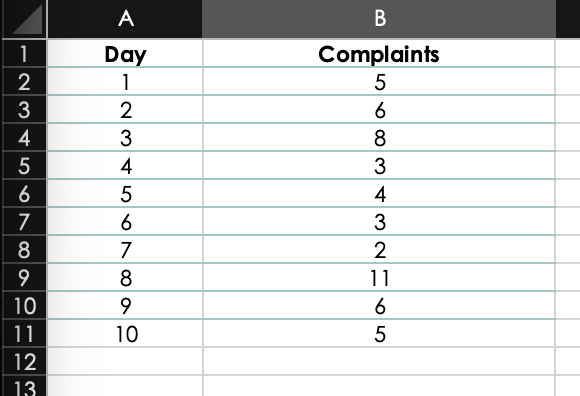
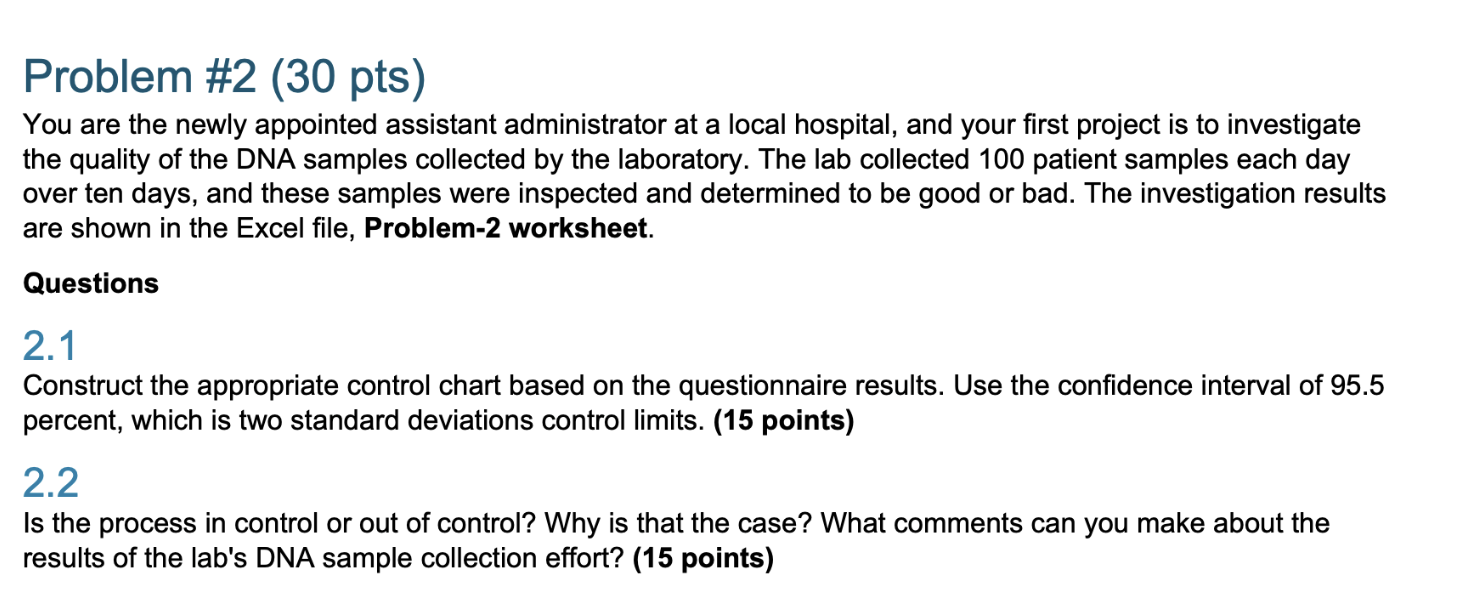
\begin{tabular}{|c|c|c|} \hline & A & B \\ \hline 1 & Day & Complaints \\ \hline 2 & 1 & 5 \\ \hline 3 & 2 & 6 \\ \hline 4 & 3 & 8 \\ \hline 5 & 4 & 3 \\ \hline 6 & 5 & 4 \\ \hline 7 & 6 & 3 \\ \hline 8 & 7 & 2 \\ \hline 9 & 8 & 11 \\ \hline 10 & 9 & 6 \\ \hline 11 & 10 & 5 \\ \hline 12 & & \\ \hline 13 & & \\ \hline \end{tabular} Problem \#2 (30 pts) You are the newly appointed assistant administrator at a local hospital, and your first project is to investigate the quality of the DNA samples collected by the laboratory. The lab collected 100 patient samples each day over ten days, and these samples were inspected and determined to be good or bad. The investigation results are shown in the Excel file, Problem-2 worksheet. Questions 2.1 Construct the appropriate control chart based on the questionnaire results. Use the confidence interval of 95.5 percent, which is two standard deviations control limits. (15 points) 2.2 Is the process in control or out of control? Why is that the case? What comments can you make about the results of the lab's DNA sample collection effort? (15 points)
Step by Step Solution
There are 3 Steps involved in it

Get step-by-step solutions from verified subject matter experts