

Question: Chapter 13 - Homework Saved 1 Part 1 of 4 10 points Required information (The following information applies to the questions displayed below.) Selected comparative

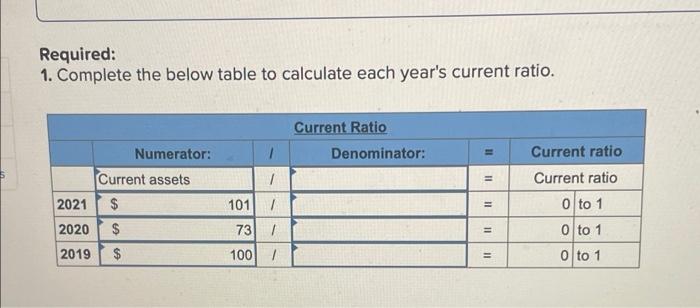
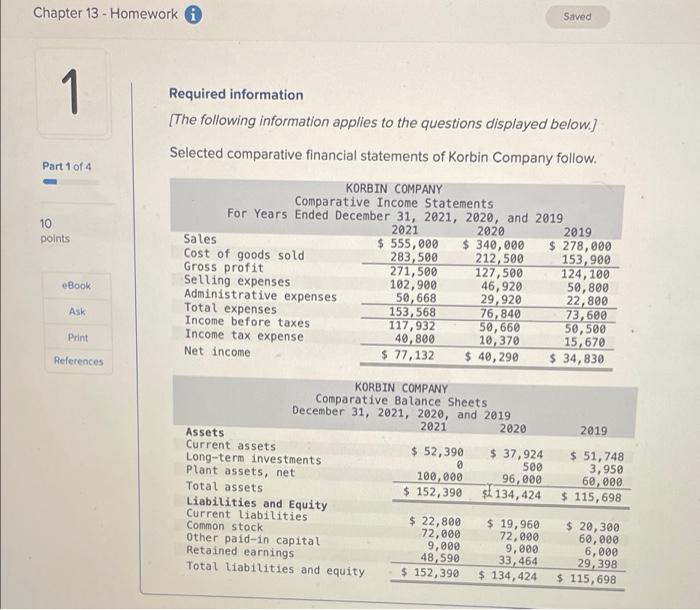

Chapter 13 - Homework Saved 1 Part 1 of 4 10 points Required information (The following information applies to the questions displayed below.) Selected comparative financial statements of Korbin Company follow. KORBIN COMPANY Comparative Income Statements For Years Ended December 31, 2021, 2020, and 2019 2021 2020 2019 Sales $ 555,000 $ 340,000 $ 278,000 Cost of goods sold 283,500 212,500 153,900 Gross profit 271,500 127,500 124, 100 Selling expenses 102,900 46,920 50,800 Administrative expenses 50,668 29,920 22,800 Total expenses 153,568 76,840 73,600 Income before taxes 117,932 50,660 50,500 Income tax expense 40,800 10,370 15,670 Net income $ 77,132 $ 40,290 $ 34,830 eBook ASK Print References 2019 KORBIN COMPANY Comparative Balance Sheets December 31, 2021, 2020, and 2019 2021 2020 Assets Current assets $ 52,390 $ 37,924 Long-term investments 500 Plant assets, net 100,000 96,000 Total assets $ 152,390 Sk 134,424 Liabilities and Equity Current liabilities $ 22,800 $ 19,96 Common stock 72,000 72,000 Other paid-in capital 9,000 9,000 Retained earnings 48,590 33,464 Total liabilities and equity $ 152,390 $ 134,424 $ 51,748 3,950 60,000 115,698 $ 20,300 60,000 6,000 29, 398 $ 115, 698 Required: 1. Complete the below table to calculate each year's current ratio. Current Ratio Denominator: Numerator: 1 11 Current ratio Current assets 1 11 2021 10111 II 16 Current ratio 0 to 1 0 to 1 O to 1 $ $ $ 2020 73 1 11 2019 100 1 Il
Step by Step Solution
There are 3 Steps involved in it

Get step-by-step solutions from verified subject matter experts