

Question: Consider a bond with a face value of $1000. Using the chart below, explain the general relationship between years to maturity, yield to maturity, and
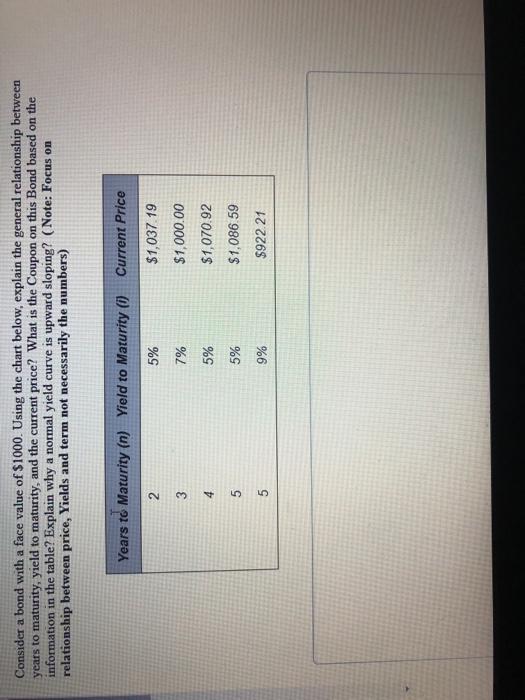
Consider a bond with a face value of $1000. Using the chart below, explain the general relationship between years to maturity, yield to maturity, and the current price? What is the Coupon on this Bond based on the information in the table? Explain why a normal yield curve is upward sloping? (Note: Focus on relationship between price, Yields and term not necessarily the numbers) Years to Maturity (n) Yield to Maturity (0) Current Price 2 5% 3 7% $1,037 19 $1,000.00 $1,070.92 $1,086.59 4 5% 5 5% 5 9% $922.21
Step by Step Solution
There are 3 Steps involved in it
1 Expert Approved Answer
Step: 1 Unlock

Question Has Been Solved by an Expert!
Get step-by-step solutions from verified subject matter experts
Step: 2 Unlock
Step: 3 Unlock