

Question: Data Table i (Click on the icon here in order to copy the contents of the data table below into a spreadsheet.) $10,000 $5,000 Year
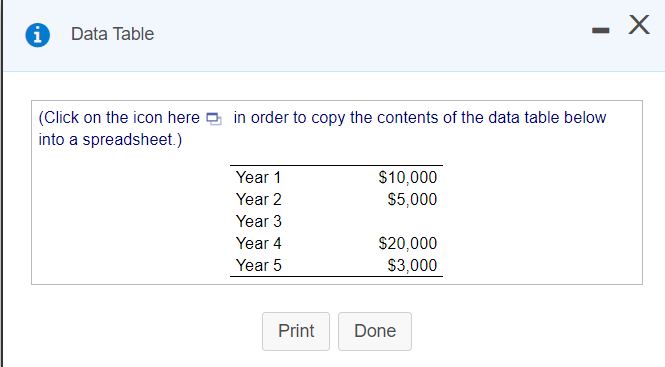


Data Table i (Click on the icon here in order to copy the contents of the data table below into a spreadsheet.) $10,000 $5,000 Year 1 Year 2 Year 3 Year 4 Year 5 $20,000 $3,000 Print Done shows a mixed cash flow stream, except that the cash flow for year 3 is missing. Suppose that somehow you know that the present value of the entire stream is Relationship between future value and present valueMixed stream The following table, E: $32,911.03, and the discount rate is 4%. What is the amount of the missing cash flow in year 3? The amount of the missing cash flow in year 3 is $ (Round to the nearest dollar.)
Step by Step Solution
There are 3 Steps involved in it
1 Expert Approved Answer
Step: 1 Unlock

Question Has Been Solved by an Expert!
Get step-by-step solutions from verified subject matter experts
Step: 2 Unlock
Step: 3 Unlock