

Question: EXERCICE 1: (4 MARKS each year 2 marks) The following items were taken from the financial statements of Sigma, over a three-year period: Item 2009
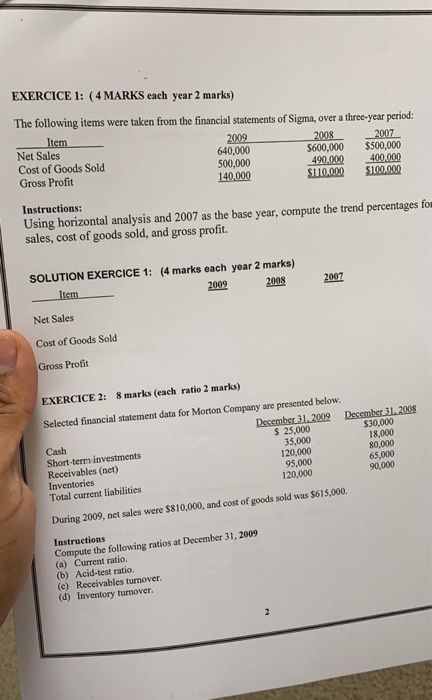
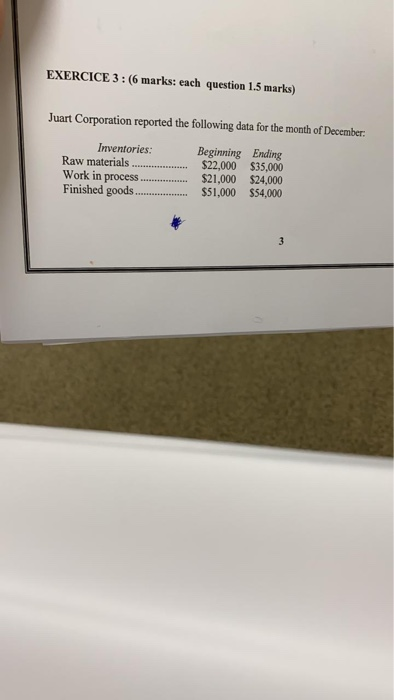
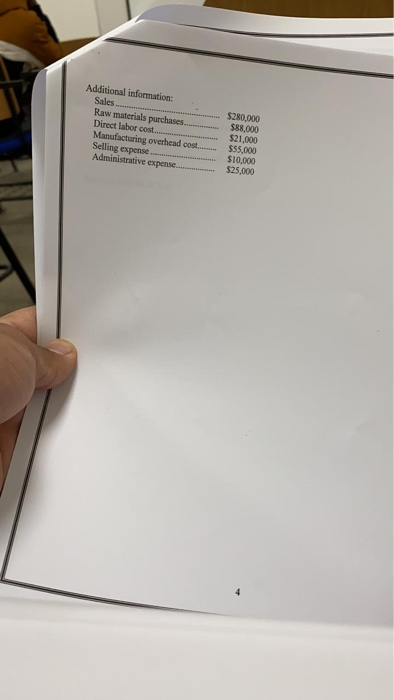
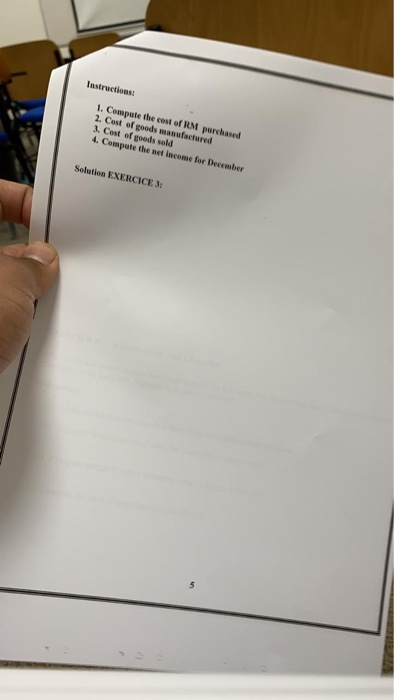
EXERCICE 1: (4 MARKS each year 2 marks) The following items were taken from the financial statements of Sigma, over a three-year period: Item 2009 2008_ 2007 Net Sales 640,000 $600,000 $500,000 Cost of Goods Sold 500,000 490.000 400.000 Gross Profit 140,000 $110.000 $100.000 Instructions: Using horizontal analysis and 2007 as the base year, compute the trend percentages for sales, cost of goods sold, and gross profit. 2007 SOLUTION EXERCICE 1: (4 marks each year 2 marks) 2009 2008 Item Net Sales Cost of Goods Sold Gross Profit EXERCICE 2: 8 marks (each ratio 2 marks) Selected financial statement data for Morton Company are presented below. December 31, 2009 December 31. 2008 $30,000 $ 25,000 Cash 18,000 35,000 Short-term investments 120,000 80,000 Receivables (net) 95,000 65,000 Inventories 120,000 90,000 Total current liabilities During 2009, net sales were $810,000, and cost of goods sold was $615,000. Instructions Compute the following ratios at December 31, 2009 (a) Current ratio. (b) Acid-test ratio. (c) Receivables turnover. (d) Inventory turnover. EXERCICE 3: (6 marks: each question 1.5 marks) Juart Corporation reported the following data for the month of December: Inventories: Beginning Ending Raw materials ............. $22,000 $35,000 Work in process.................. $21,000 $24,000 Finished goods............. $51,000 $54,000 Additional information: Sales.. Raw materials purchases........... Direct labor cost. Manufacturing overhead cost...... Selling expense......... Administrative expense.... $280,000 SO8.000 $21,000 $55.000 $10,000 $25,000 Instructions: 1. Compute the cost of RM purchased 2. Cest of goods manufactured 3. Cost of goods sold 4. Compute the net income for December Solution EXERCICE 3
Step by Step Solution
There are 3 Steps involved in it

Get step-by-step solutions from verified subject matter experts