

Question: Exercise 13-7 Analyzing liquidity LO P3 Simon Company's year-end balance sheets follow. Current Yr 1 Yr Ago 2 Yrs Ago At December 31 Assets Cash

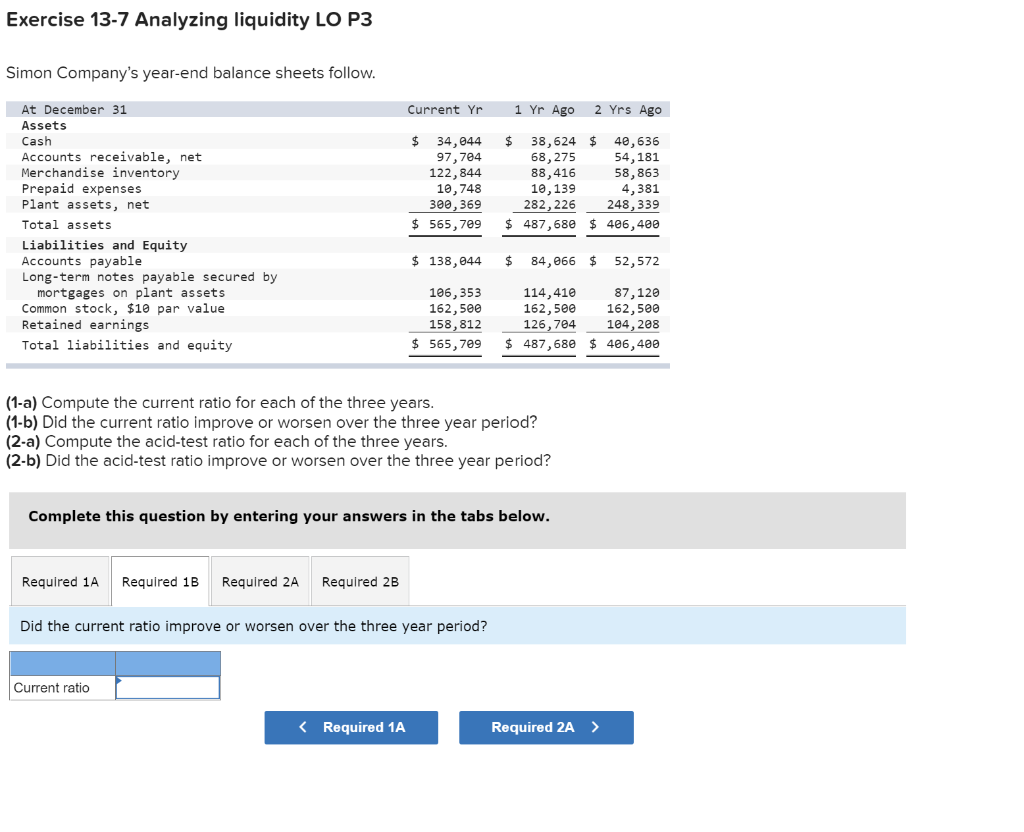
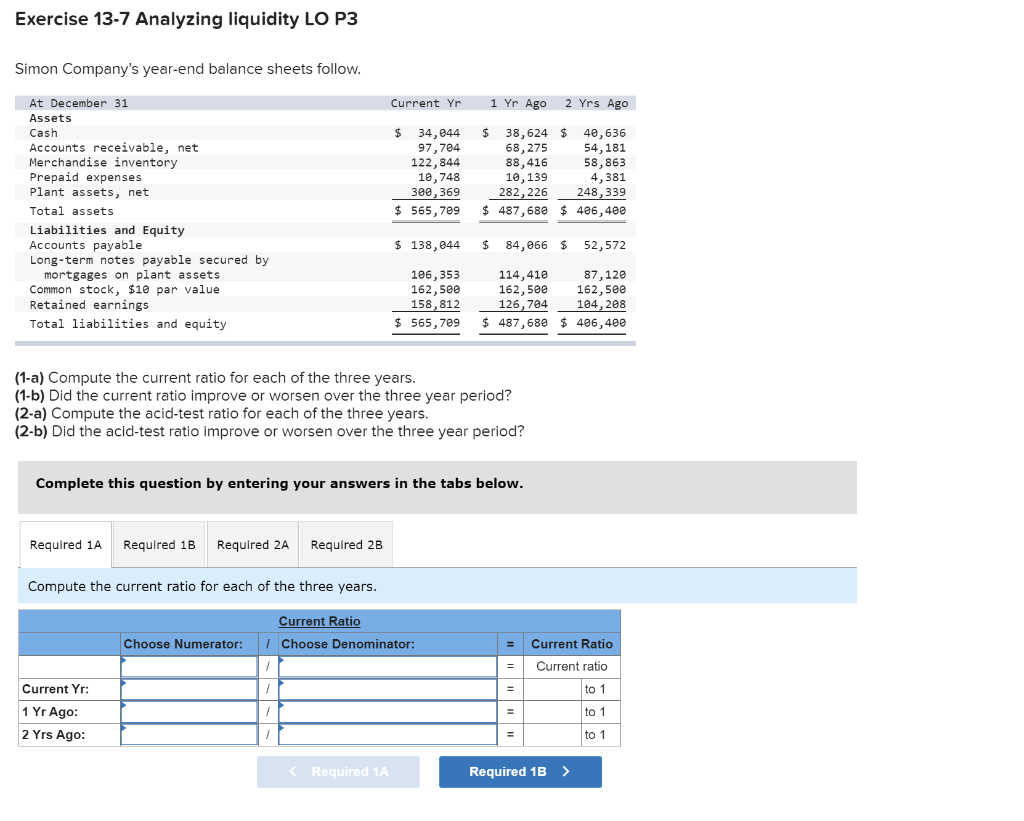

Exercise 13-7 Analyzing liquidity LO P3 Simon Company's year-end balance sheets follow. Current Yr 1 Yr Ago 2 Yrs Ago At December 31 Assets Cash Accounts receivable, net Merchandise inventory Prepaid expenses Plant assets, net Total assets Liabilities and Equity Accounts payable Long-term notes payable secured by mortgages on plant assets Common stock, $10 par value Retained earnings Total liabilities and equity $ 34,044 97,784 122,844 18,748 300, 369 $ 565,709 $ 38,624 $ 40,636 68,275 54,181 88,416 58,863 10,139 4,381 282,226 248,339 $ 487,680 $ 406,400 $ 138,044 $ 84,066 $ 52,572 106,353 162,50e 158,812 $ 565,709 114,410 87,120 162,500 162,500 126,704 104,208 $ 487,680 $ 406,400 (1-a) Compute the current ratio for each of the three years. (1-b) Did the current ratio improve or worsen over the three year period? (2-a) Compute the acid-test ratio for each of the three years. (2-b) Did the acid-test ratio improve or worsen over the three year period? Complete this question by entering your answers in the tabs below. Required 1A Required 1B Required 2A Required 2B Compute the current ratio for each of the three years. Current Ratio 1 Choose Denominator: Choose Numerator: = Current Ratio Current ratio to 1 Current Yr: 1 to 1 1 Yr Ago: 2 Yrs Ago: to 1 Exercise 13-7 Analyzing liquidity LO P3 Simon Company's year-end balance sheets follow. Current Yr 1 Yr Ago 2 Yrs Ago At December 31 Assets Cash Accounts receivable, net Merchandise inventory Prepaid expenses Plant assets, net Total assets Liabilities and Equity Accounts payable Long-term notes payable secured by mortgages on plant assets Common stock, $10 par value Retained earnings Total liabilities and equity $ 34,044 97,784 122,844 10,748 300, 369 $ 565, 709 $ 38,624 $ 40, 636 68,275 54,181 88,416 58,863 10,139 4,381 282,226 248,339 $ 487,680 $ 406,400 $ 138,044 $ 84,066 $ 52,572 106,353 162,500 158, 812 $ 565,709 114,410 87, 120 162,500 162,500 126,704 104,208 $ 487,680 $ 406,400 (1-a) Compute the current ratio for each of the three years. (1-b) Did the current ratio improve or worsen over the three year period? (2-a) Compute the acid-test ratio for each of the three years. (2-b) Did the acid-test ratio improve or worsen over the three year period? Complete this question by entering your answers in the tabs below. Required 1A Required 1B Required 2A Required 2B Did the current ratio improve or worsen over the three year period? Current ratio
Step by Step Solution
There are 3 Steps involved in it

Get step-by-step solutions from verified subject matter experts