

Question: Exercise 2.1 Data collected on the yearly demand for 50-pound bags of fertilizer at Wallace Garden Supply are shown below: Demand for fertilizer (in 1000's
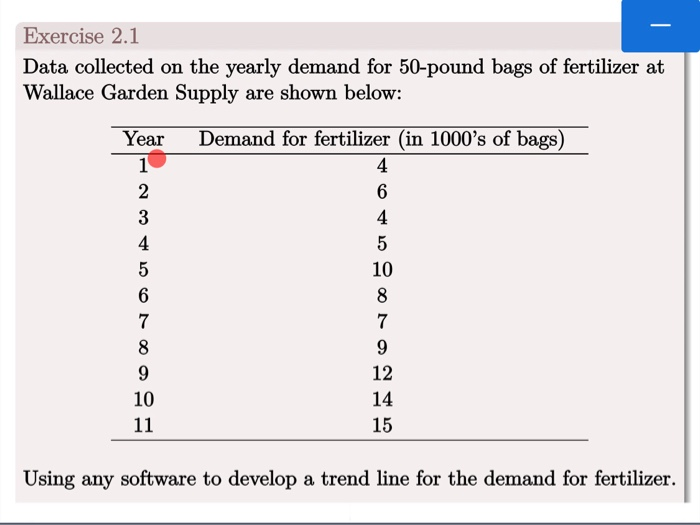
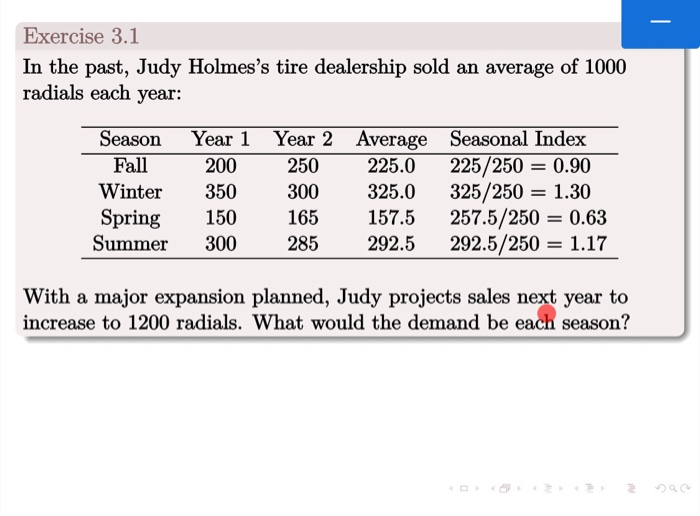
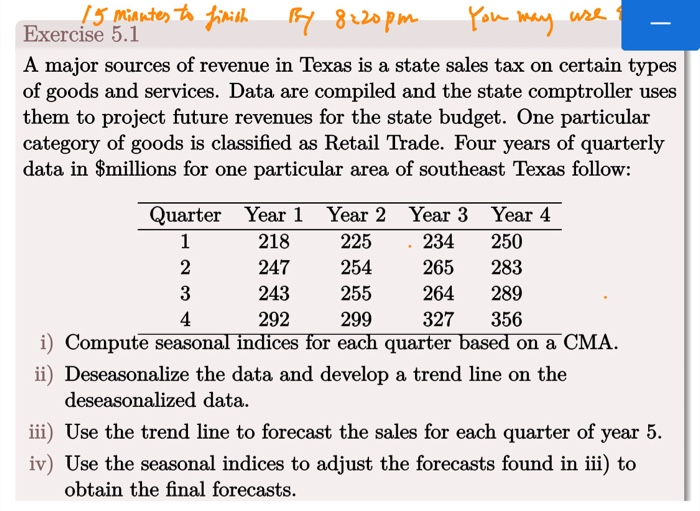
Exercise 2.1 Data collected on the yearly demand for 50-pound bags of fertilizer at Wallace Garden Supply are shown below: Demand for fertilizer (in 1000's of bags) Using any software to develop a trend line for the demand for fertilizer. Exercise 3.1 In the past, Judy Holmes's tire dealership sold an average of 1000 radials each year: Year 1 200 Season Fall Winter Spring Summer 350 150 300 Year 2 250 300 165 285 Average Seasonal Index 225.0 225/250 = 0.90 325.0 325/250 = 1.30 157.5 257.5/250 = 0.63 292.5 292.5/250 = 1.17 With a major expansion planned, Judy projects sales next year to increase to 1200 radials. What would the demand be each season? 5 Minutes to finish 17 220pm You may use a Exercise 5.1 A major sources of revenue in Texas is a state sales tax on certain types of goods and services. Data are compiled and the state comptroller uses them to project future revenues for the state budget. One particular category of goods is classified as Retail Trade. Four years of quarterly data in $millions for one particular area of southeast Texas follow: Quarter Year 1 Year 2 Year 3 Year 4 1 218 225 234 250 2 247 254 265 283 243 255 264 289 292 299 327 356 i) Compute seasonal indices for each quarter based on a CMA. ii) Deseasonalize the data and develop a trend line on the deseasonalized data. iii) Use the trend line to forecast the sales for each quarter of year 5. iv) Use the seasonal indices to adjust the forecasts found in iii) to obtain the final forecasts
Step by Step Solution
There are 3 Steps involved in it

Get step-by-step solutions from verified subject matter experts