

Question: Mean interarrival time from outside minutes) Arrival rate from outside 6.00 per minute) 5 Branching probabilities 6 Sign in to Registration 7 Sign in to
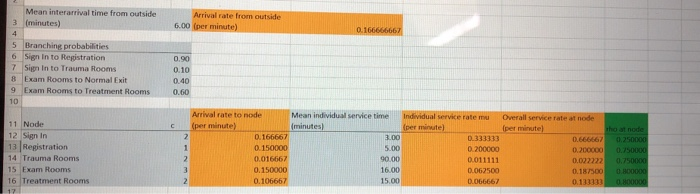
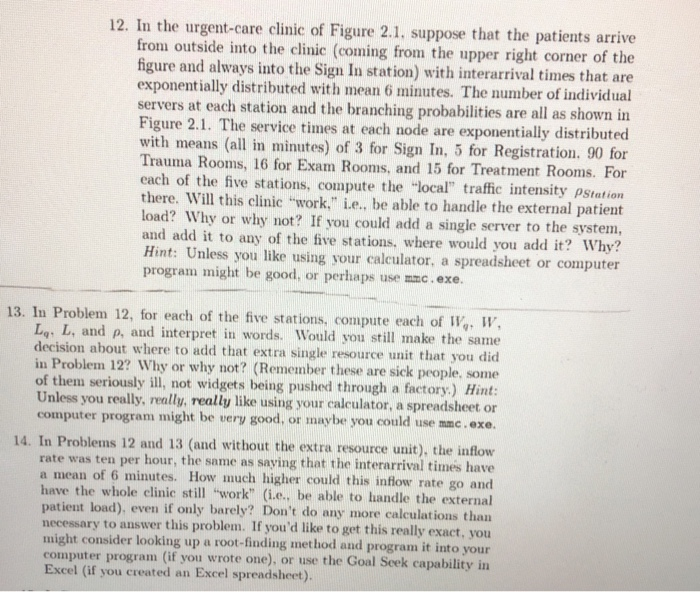
Mean interarrival time from outside minutes) Arrival rate from outside 6.00 per minute) 5 Branching probabilities 6 Sign in to Registration 7 Sign in to Trauma Rooms 8 Exam Rooms to Normal Exit 9 Exam Rooms to Treatment Rooms 0.10 0.60 Individual service rate mu Overall service rate at node 0333333 0.666667 25000 11 Node 12 Sign In 13 Registration 14 Trauma Rooms 15 Exam Rooms 16 Treatment Rooms Mean individual service time minutes) 0.166667 0.150000 0.016667 0.00 0.150000 16.00 0.106667 0.011111 0.067500 0. 67 0.187500 12. In the urgent-care clinic of Figure 2.1. suppose that the patients arrive from outside into the clinic (coming from the upper right corner of the figure and always into the Sign In station) with interarrival times that are exponentially distributed with mean 6 minutes. The number of individual servers at each station and the branching probabilities are all as shown in Figure 2.1. The service times at each node are exponentially distributed with means (all in minutes) of 3 for Sign In, 5 for Registration. 90 for Trauma Rooms, 16 for Exam Rooms, and 15 for Treatment Rooms. For each of the five stations, compute the "local" traffic intensity PStation there. Will this clinic "work," i.e., be able to handle the external patient load? Why or why not? If you could add a single server to the system, and add it to any of the five stations, where would you add it? Why? Hint: Unless you like using your calculator, a spreadsheet or computer program might be good, or perhaps use mac.exe. 13. In Problem 12, for each of the five stations, compute each of WV, W, Ly, L, and p, and interpret in words. Would you still make the same decision about where to add that extra single resource unit that you did in Problem 12? Why or why not? (Remember these are sick people, some of them seriously ill, not widgets being pushed through a factory.) Hint: Unless you really, really, really like using your calculator, a spreadsheet or computer program might be very good, or maybe you could use mmc.exe. 14. In Problems 12 and 13 (and without the extra resource unit), the inflow rate was ten per hour, the same as saying that the interarrival times have a mean of 6 minutes. How much higher could this inflow rate go and have the whole clinic still work (i.e., be able to handle the external patient load), even if only barely? Don't do any more calculations than necessary to answer this problem. If you'd like to get this really exact, you might consider looking up a root-finding method and program it into your computer program (if you wrote one), or use the Goal Seek capability in Excel (if you created an Excel spreadsheet). Mean interarrival time from outside minutes) Arrival rate from outside 6.00 per minute) 5 Branching probabilities 6 Sign in to Registration 7 Sign in to Trauma Rooms 8 Exam Rooms to Normal Exit 9 Exam Rooms to Treatment Rooms 0.10 0.60 Individual service rate mu Overall service rate at node 0333333 0.666667 25000 11 Node 12 Sign In 13 Registration 14 Trauma Rooms 15 Exam Rooms 16 Treatment Rooms Mean individual service time minutes) 0.166667 0.150000 0.016667 0.00 0.150000 16.00 0.106667 0.011111 0.067500 0. 67 0.187500 12. In the urgent-care clinic of Figure 2.1. suppose that the patients arrive from outside into the clinic (coming from the upper right corner of the figure and always into the Sign In station) with interarrival times that are exponentially distributed with mean 6 minutes. The number of individual servers at each station and the branching probabilities are all as shown in Figure 2.1. The service times at each node are exponentially distributed with means (all in minutes) of 3 for Sign In, 5 for Registration. 90 for Trauma Rooms, 16 for Exam Rooms, and 15 for Treatment Rooms. For each of the five stations, compute the "local" traffic intensity PStation there. Will this clinic "work," i.e., be able to handle the external patient load? Why or why not? If you could add a single server to the system, and add it to any of the five stations, where would you add it? Why? Hint: Unless you like using your calculator, a spreadsheet or computer program might be good, or perhaps use mac.exe. 13. In Problem 12, for each of the five stations, compute each of WV, W, Ly, L, and p, and interpret in words. Would you still make the same decision about where to add that extra single resource unit that you did in Problem 12? Why or why not? (Remember these are sick people, some of them seriously ill, not widgets being pushed through a factory.) Hint: Unless you really, really, really like using your calculator, a spreadsheet or computer program might be very good, or maybe you could use mmc.exe. 14. In Problems 12 and 13 (and without the extra resource unit), the inflow rate was ten per hour, the same as saying that the interarrival times have a mean of 6 minutes. How much higher could this inflow rate go and have the whole clinic still work (i.e., be able to handle the external patient load), even if only barely? Don't do any more calculations than necessary to answer this problem. If you'd like to get this really exact, you might consider looking up a root-finding method and program it into your computer program (if you wrote one), or use the Goal Seek capability in Excel (if you created an Excel spreadsheet)
Step by Step Solution
There are 3 Steps involved in it

Get step-by-step solutions from verified subject matter experts