

Question: P12-61A (similar to) 3 Question Help : (Click the icon to view selected income statement data.) Selected data from Trenton Furniture, Inc., follows. (Click the
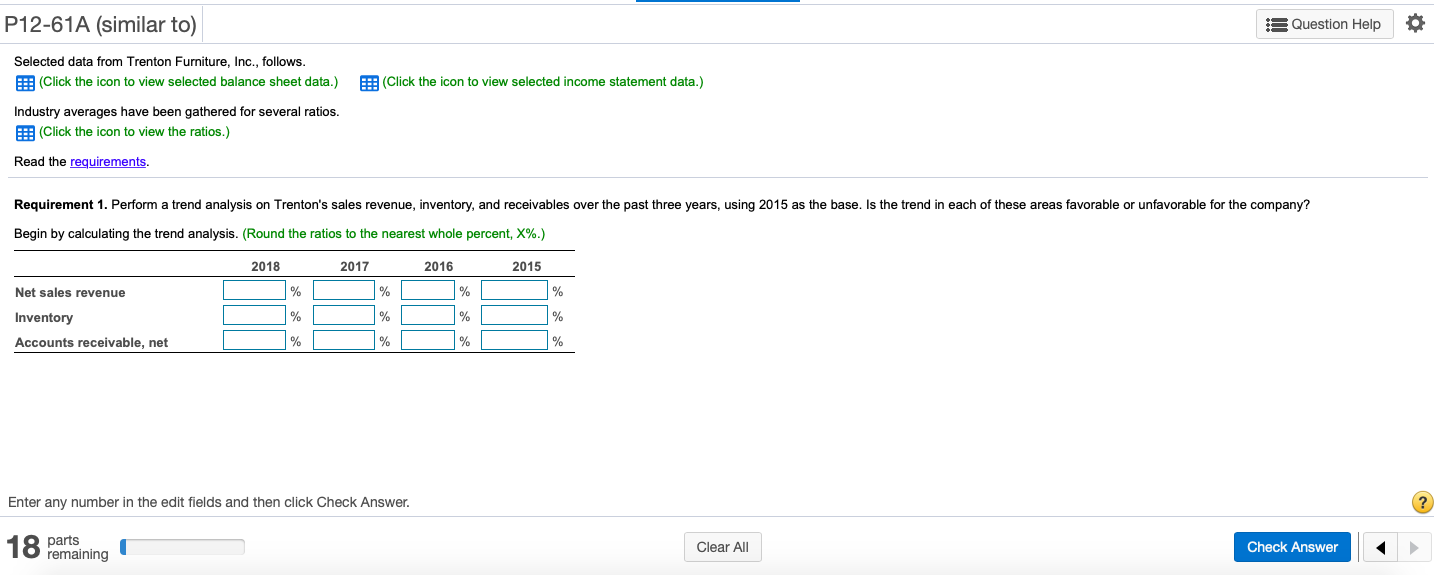
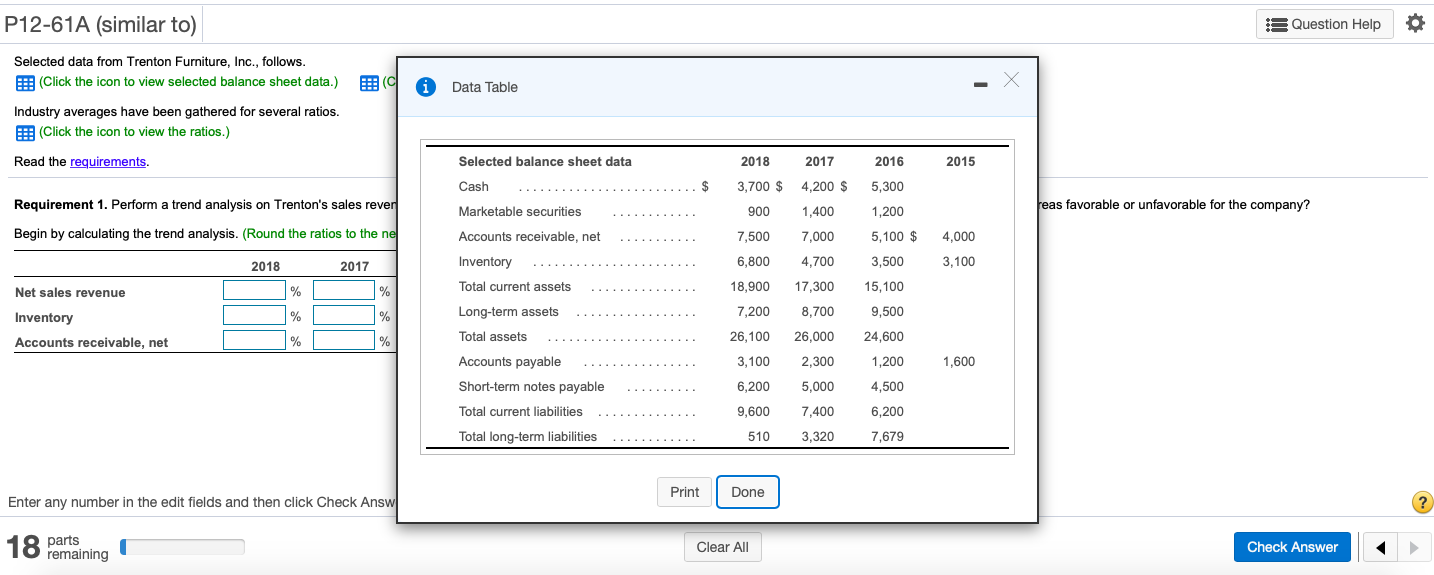
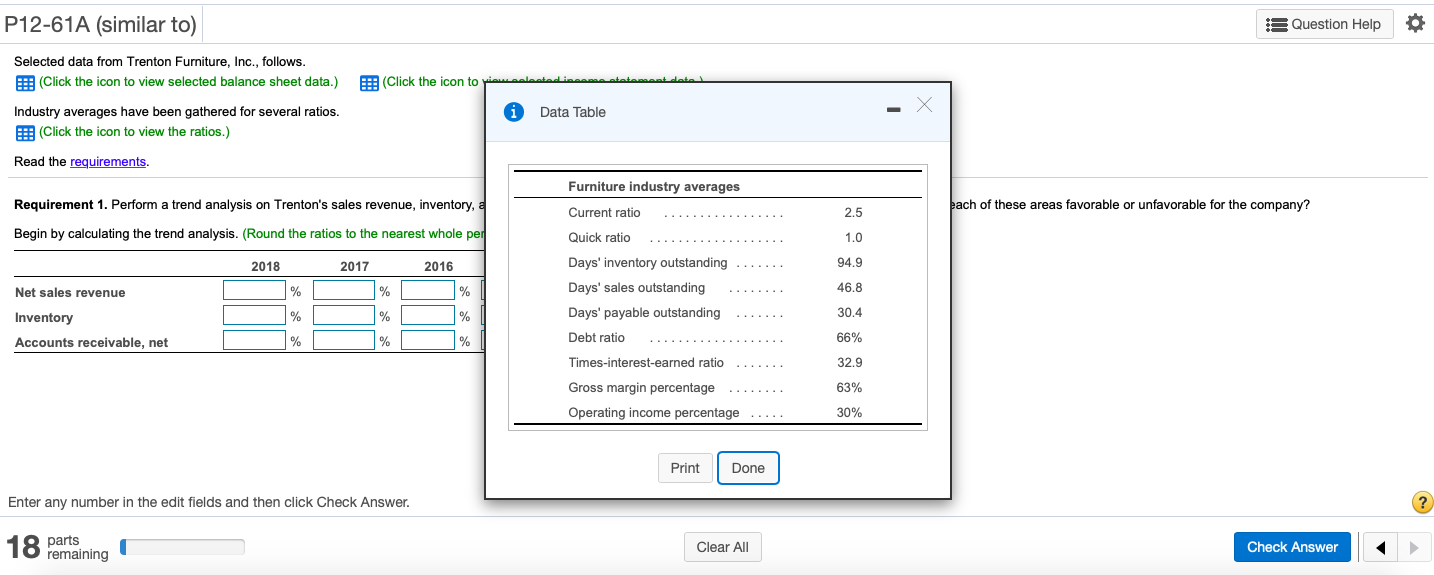
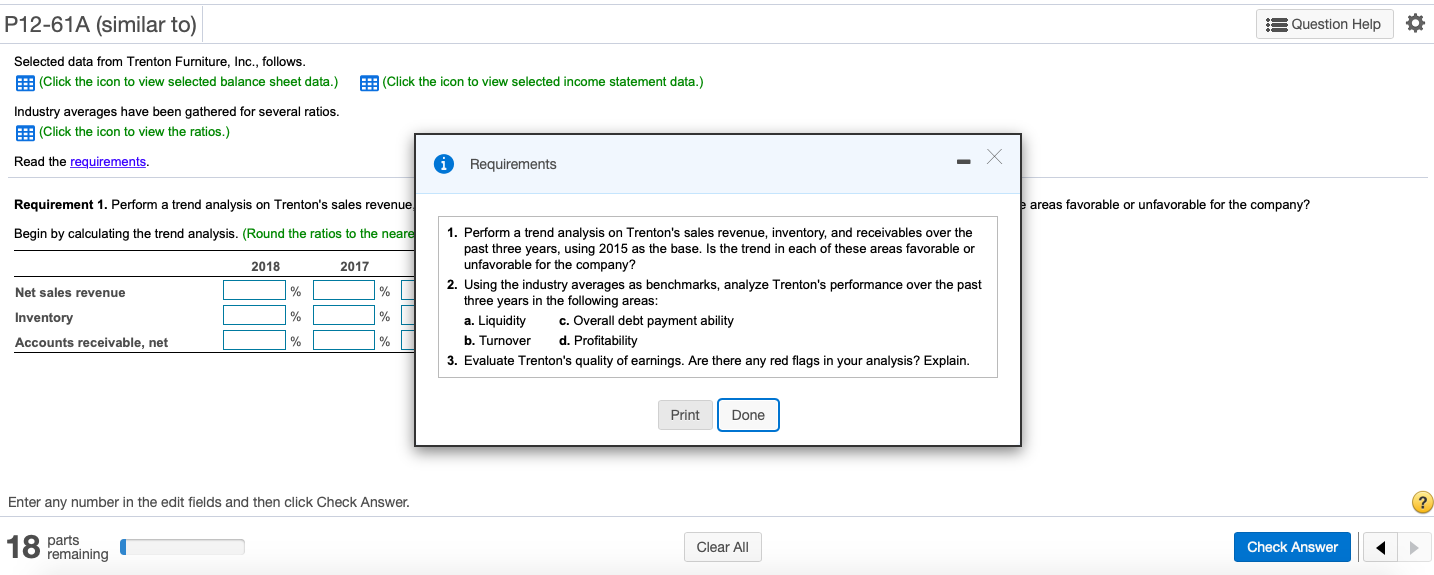
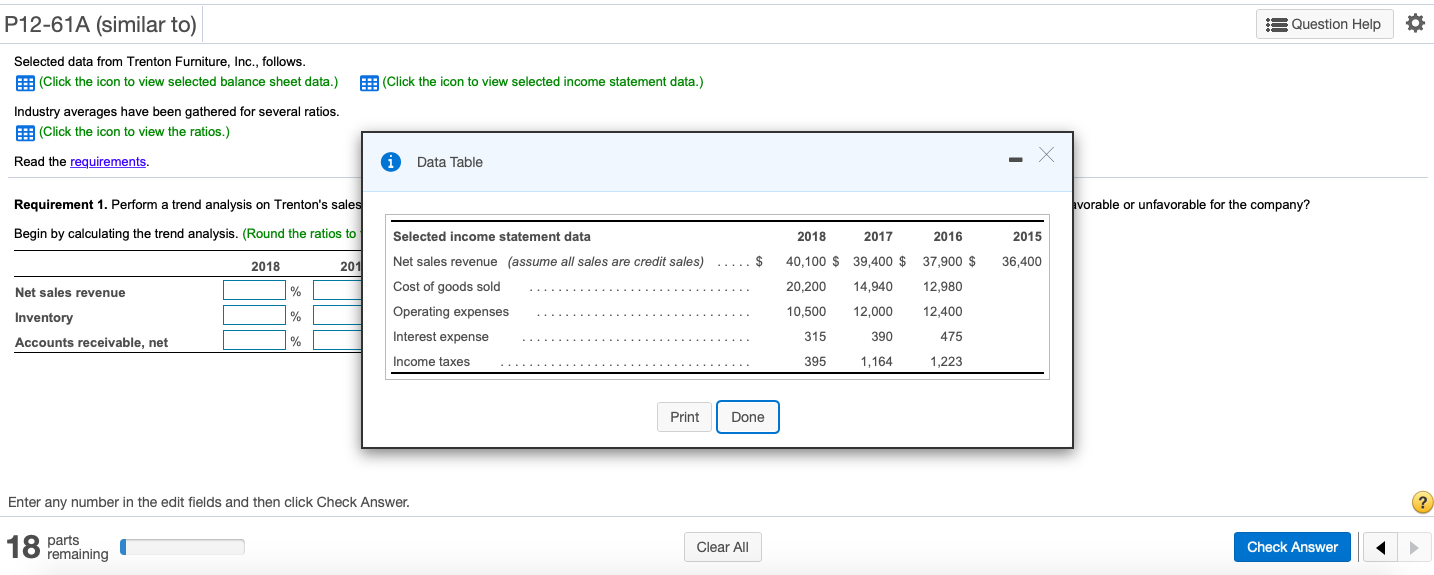
P12-61A (similar to) 3 Question Help : (Click the icon to view selected income statement data.) Selected data from Trenton Furniture, Inc., follows. (Click the icon to view selected balance sheet data.) Industry averages have been gathered for several ratios. (Click the icon to view the ratios.) Read the requirements. Requirement 1. Perform a trend analysis on Trenton's sales revenue, inventory, and receivables over the past three years, using 2015 as the base. Is the trend in each of these areas favorable or unfavorable for the company? Begin by calculating the trend analysis. (Round the ratios to the nearest whole percent, X%.) 2018 2017 2016 2015 Net sales revenue % % % % % % % Inventory Accounts receivable, net % % % % % Enter any number in the edit fields and then click Check Answer. ? 18 parts Clear All Check Answer remaining P12-61A (similar to) 3 Question Help Data Table Selected data from Trenton Furniture, Inc., follows. (Click the icon to view selected balance sheet data.) Industry averages have been gathered for several ratios. (Click the icon to view the ratios.) Read the requirements. Selected balance sheet data 2018 2017 2016 2015 Cash 3,700 $ 4,200 $ 5,300 Marketable securities 900 1,400 1,200 reas favorable or unfavorable for the company? Requirement 1. Perform a trend analysis on Trenton's sales rever Begin by calculating the trend analysis. (Round the ratios to the ne Accounts receivable, net 7,500 7,000 5,100 $ 4,000 2018 2017 6,800 4,700 3,500 3,100 Inventory Total current assets % Net sales revenue 17,300 % 18,900 15,100 % % 7,200 8.700 9,500 Inventory Accounts receivable, net % % 26,100 26,000 24,600 Long-term assets Total assets Accounts payable Short-term notes payable Total current liabilities 3,100 2,300 1,200 1,600 6,200 5,000 4,500 9,600 7,400 6,200 Total long-term liabilities 510 3,320 7,679 Print Done Enter any number in the edit fields and then click Check Answ ? 18 parts Clear All Check Answer remaining P12-61A (similar to) 3 Question Help otetta E: (Click the icon to Selected data from Trenton Furniture, Inc., follows. (Click the icon to view selected balance sheet data.) Industry averages have been gathered for several ratios. (Click the icon to view the ratios.) Data Table Read the requirements. Furniture industry averages Current ratio pach of these areas favorable or unfavorable for the company? 2.5 Requirement 1. Perform a trend analysis on Trenton's sales revenue, inventory, a Begin by calculating the trend analysis. (Round the ratios to the nearest whole per Quick ratio 1.0 94.9 2018 2017 2016 Net sales revenue % % % 46.8 Days' inventory outstanding Days' sales outstanding Days' payable outstanding Debt ratio % % % 30.4 Inventory Accounts receivable, net % % 66% Times-interest-earned ratio 32.9 63% Gross margin percentage Operating income percentage 30% Print Done Enter any number in the edit fields and then click Check Answer. ? 18 parts Clear All Check Answer remaining P12-61A (similar to) 3 Question Help : (Click the icon to view selected income statement data.) Selected data from Trenton Furniture, Inc., follows. (Click the icon to view selected balance sheet data.) Industry averages have been gathered for several ratios. (Click the icon to view the ratios.) Read the requirements. Requirements Requirement 1. Perform a trend analysis on Trenton's sales revenue areas favorable or unfavorable for the company? Begin by calculating the trend analysis. (Round the ratios to the neare 2018 2017 Net sales revenue % 1. Perform trend analysis on Trenton's sales revenue, inventory, and receivables over the past three years, using 2015 as the base. Is the trend in each of these areas favorable or unfavorable for the company? 2. Using the industry averages as benchmarks, analyze Trenton's performance over the past three years in the following areas: a. Liquidity c. Overall debt payment ability b. Turnover d. Profitability 3. Evaluate Trenton's quality of earnings. Are there any red flags in your analysis? Explain. % % % % Inventory Accounts receivable, net % Print Done Enter any number in the edit fields and then click Check Answer. ? 18 parts Clear All Check Answer remaining P12-61A (similar to) 3 Question Help : (Click the icon to view selected income statement data.) Selected data from Trenton Furniture, Inc., follows. (Click the icon to view selected balance sheet data.) Industry averages have been gathered for several ratios. (Click the icon to view the ratios.) Read the requirements. Data Table avorable or unfavorable for the company? Requirement 1. Perform a trend analysis on Trenton's sales Begin by calculating the trend analysis. (Round the ratios to Selected income statement data 2018 2017 2016 2015 2018 2011 36,400 Net sales revenue (assume all sales are credit sales) Cost of goods sold 40,100 $ 39,400 $ 20.200 14,940 37,900 $ 12,980 Net sales revenue % % 10,500 12,000 12,400 Inventory Accounts receivable, net Operating expenses Interest expense % 315 390 475 Income taxes 395 1,164 1,223 Print Done Enter any number in the edit fields and then click Check Answer. ? 18 parts Clear All Check Answer remaining
Step by Step Solution
There are 3 Steps involved in it

Get step-by-step solutions from verified subject matter experts