

Question: Problem 11-11 Question Help Using the data in the following table, and the fact that the correlation of A and B is 0.63, calculate the
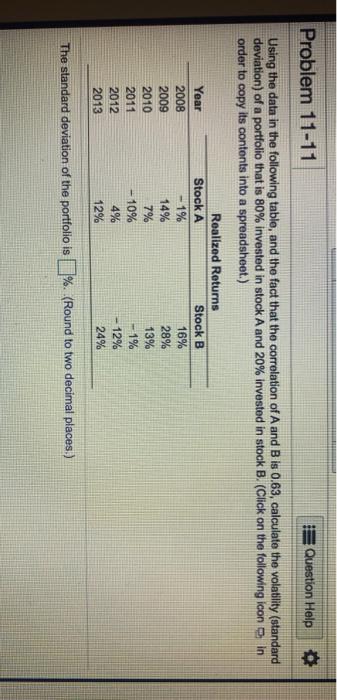
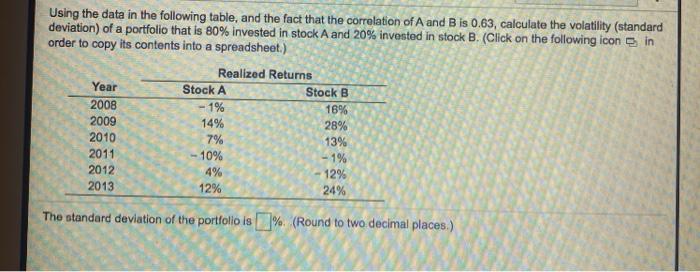
Problem 11-11 Question Help Using the data in the following table, and the fact that the correlation of A and B is 0.63, calculate the volatility (standard deviation) of a portfolio that is 80% invested in stock A and 20% invested in stock B. (Click on the following icon in order to copy its contents into a spreadsheet.) Realized Returns Year Stock A Stock B 2008 - 1% 16% 2009 14% 28% 2010 7% 13% 2011 10% - 1% 2012 4% - 12% 2013 12% 24% The standard deviation of the portfolio is 1%. (Round to two decimal paces.) Using the data in the following table, and the fact that the correlation of A and B is 0.63, calculate the volatility (standard deviation) of a portfolio that is 80% invested in stock A and 20% invested in stock B. (Click on the following icon in order to copy its contents into a spreadsheet.) Realized Returns Year Stock A Stock B 2008 - 1% 16% 2009 14% 28% 2010 7% 13% 2011 10% - 1% 2012 4% 12% 2013 12% 24% The standard deviation of the portfolio is % (Round to two decimal places.)
Step by Step Solution
There are 3 Steps involved in it

Get step-by-step solutions from verified subject matter experts