

Question: Problem 13-1A Calculation and analysis of trend percents LO A1, P1 Selected comparative financial statements of Haroun Company follow. ($ thousands) Sales Cost of goods
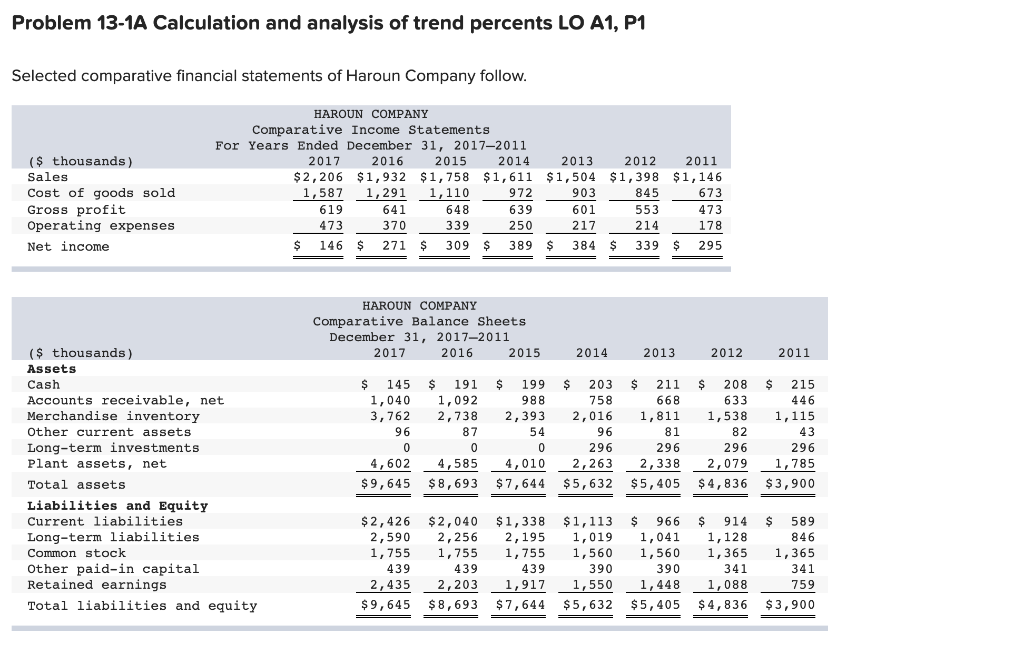
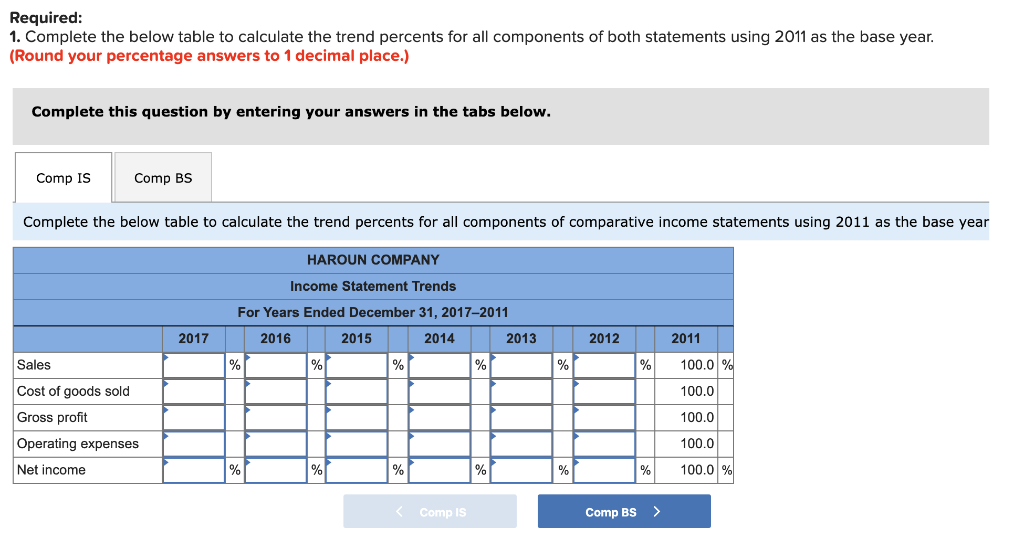
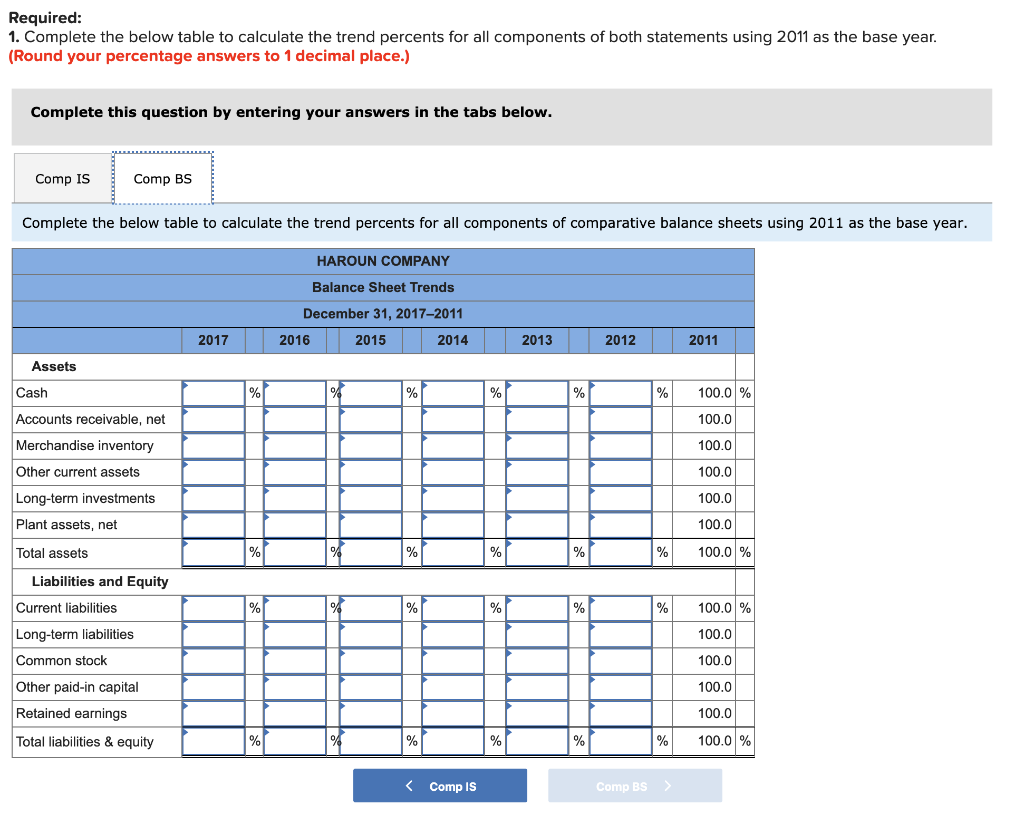
Problem 13-1A Calculation and analysis of trend percents LO A1, P1 Selected comparative financial statements of Haroun Company follow. ($ thousands) Sales Cost of goods sold Gross profit Operating expenses Net income HAROUN COMPANY Comparative Income Statements For Years Ended December 31, 2017-2011 2017 2016 2015 2014 2013 $2,206 $1,932 $1,758 $1,611 $1,504 1,587 1,291 1,110 972 903 619 641 648 639 473 370 339 250 217 $ 146 $ 271 $ 309 $ 389 $ 384 2012 2011 $1,398 $1,146 845 673 473 178 $ 339 $ 295 553 214 HAROUN COMPANY Comparative Balance Sheets December 31, 20172011 2017 2016 2015 2014 2013 2012 2011 $ 145 1,040 3,762 96 ($ thousands ) Assets Cash Accounts receivable, net Merchandise inventory Other current assets Long-term investments Plant assets, net Total assets Liabilities and Equity Current liabilities Long-term liabilities Common stock Other paid-in capital Retained earnings Total liabilities and equity $ 191 1,092 2,738 87 0 4,585 $8,693 $ 199 988 2,393 54 0 4,010 $ 7,644 $ 203 758 2,016 96 296 2,263 $5,632 $ 211 668 1,811 81 296 2,338 $5,405 $ 208 633 1,538 82 296 2,079 $4,836 $ 215 446 1,115 43 296 1,785 $3,900 4,602 $9,645 $ 2,426 2,590 1,755 439 2,435 $9,645 $2,040 2,256 1,755 439 2,203 $8,693 $1,338 2,195 1,755 439 1,917 $ 7,644 $1,113 1,019 1,560 390 1,550 $5,632 $ 966 1,041 1,560 390 1,448 $5,405 $ 914 1,128 1,365 341 1,088 $4,836 $ 589 846 1,365 341 759 $3,900 Required: 1. Complete the below table to calculate the trend percents for all components of both statements using 2011 as the base year. (Round your percentage answers to 1 decimal place.) Complete this question by entering your answers in the tabs below. Comp IS Comp BS Complete the below table to calculate the trend percents for all components of comparative income statements using 2011 as the base year HAROUN COMPANY Income Statement Trends For Years Ended December 31, 2017-2011 2016 2015 2014 2013 2017 2012 Sales Cost of goods sold Gross profit Operating expenses Net income 2011 100.0 % 100.0 100.0 100.0 100.0% % %
Step by Step Solution
There are 3 Steps involved in it

Get step-by-step solutions from verified subject matter experts