

Question: Question 4 [25 points) The following are hypothetical production possibilities tables for China and Russia China's Production Possibilities Table Russia's Production Possibilities Table (Millions of
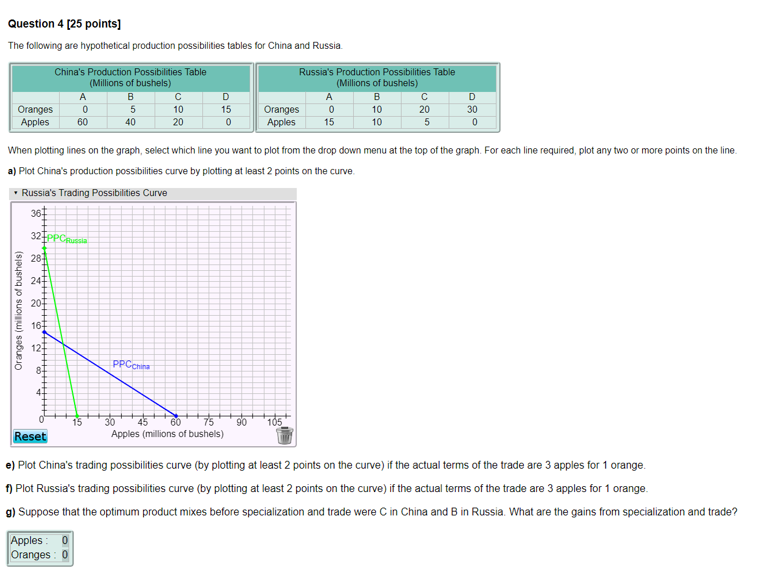
Question 4 [25 points) The following are hypothetical production possibilities tables for China and Russia China's Production Possibilities Table Russia's Production Possibilities Table (Millions of bushels) (Millions of bushels) B D B D Oranges 0 5 10 15 Oranges 0 10 20 30 Apples 60 40 20 0 Apples 15 10 5 0 When plotting lines on the graph, select which line you want to plot from the drop down menu at the top of the graph. For each line required, plot any two or more points on the line. a) Plot China's production possibilities curve by plotting at least 2 points on the curve Russia's Trading Possibilities Curve 361 327PPE 287 24 207 Oranges (millions of bushels) 161 127 PPCChina 8 15 90 30 45 60 75 105 Reset Apples (millions of bushels) e) Plot China's trading possibilities curve (by plotting at least 2 points on the curve) if the actual terms of the trade are 3 apples for 1 orange. f) Plot Russia's trading possibilities curve (by plotting at least 2 points on the curve) if the actual terms of the trade are 3 apples for 1 orange g) Suppose that the optimum product mixes before specialization and trade were in China and B in Russia. What are the gains from specialization and trade? Apples: 0 Oranges: 0 Question 4 [25 points) The following are hypothetical production possibilities tables for China and Russia China's Production Possibilities Table Russia's Production Possibilities Table (Millions of bushels) (Millions of bushels) B D B D Oranges 0 5 10 15 Oranges 0 10 20 30 Apples 60 40 20 0 Apples 15 10 5 0 When plotting lines on the graph, select which line you want to plot from the drop down menu at the top of the graph. For each line required, plot any two or more points on the line. a) Plot China's production possibilities curve by plotting at least 2 points on the curve Russia's Trading Possibilities Curve 361 327PPE 287 24 207 Oranges (millions of bushels) 161 127 PPCChina 8 15 90 30 45 60 75 105 Reset Apples (millions of bushels) e) Plot China's trading possibilities curve (by plotting at least 2 points on the curve) if the actual terms of the trade are 3 apples for 1 orange. f) Plot Russia's trading possibilities curve (by plotting at least 2 points on the curve) if the actual terms of the trade are 3 apples for 1 orange g) Suppose that the optimum product mixes before specialization and trade were in China and B in Russia. What are the gains from specialization and trade? Apples: 0 Oranges: 0
Step by Step Solution
There are 3 Steps involved in it

Get step-by-step solutions from verified subject matter experts