

Question: ROI, Margin, Turnover Allard, Inc., presented two years of data for its Frozen Foods Division and its Canned Foods Division Frozen Foods Division: Year 1


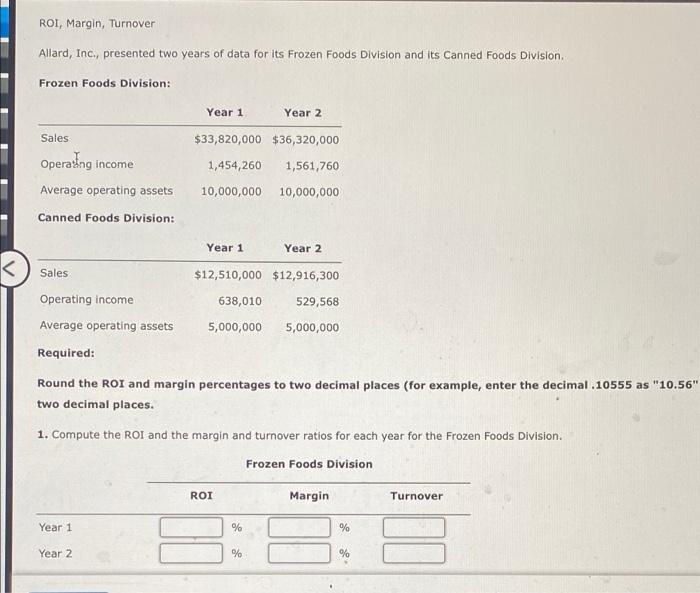
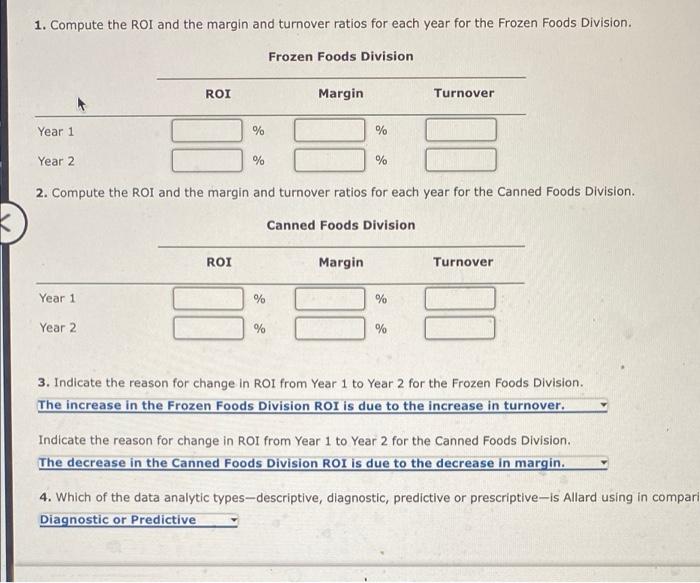
ROI, Margin, Turnover Allard, Inc., presented two years of data for its Frozen Foods Division and its Canned Foods Division Frozen Foods Division: Year 1 Year 2 Sales $33,820,000 $36,320,000 1,454,260 1,561,760 Operating income Average operating assets 10,000,000 10,000,000 Canned Foods Division: Year 1 Year 2 K Sales $12,510,000 $12,916,300 Operating income 638,010 529,568 Average operating assets 5,000,000 5,000,000 Required: Round the ROI and margin percentages to two decimal places (for example, enter the decimal .10555 as "10.56" two decimal places. 1. Compute the ROI and the margin and turnover ratios for each year for the Frozen Foods Division. Frozen Foods Division ROI Margin Turnover Year 1 % % Year 2 % % 1. Compute the ROI and the margin and turnover ratios for each year for the Frozen Foods Division. Frozen Foods Division ROI Margin Turnover Year 1 % % Year 2 % % 2. Compute the ROI and the margin and turnover ratios for each year for the Canned Foods Division Canned Foods Division ROI Margin Turnover Year 1 % % Year 2 % % 3. Indicate the reason for change in ROI from Year 1 to Year 2 for the Frozen Foods Division. The increase in the Frozen Foods Division ROI is due to the increase in turnover. Indicate the reason for change in ROI from Year 1 to Year 2 for the Canned Foods Division. The decrease in the Canned Foods Division ROI is due to the decrease in margin. 4. Which of the data analytic types-descriptive, diagnostic, predictive or prescriptive-is Allard using in compari Diagnostic or Predictive
Step by Step Solution
There are 3 Steps involved in it

Get step-by-step solutions from verified subject matter experts