

Question: The graphics above, labeled 1-6, represent combinations of a minimum variance portfolio (MV) and its component assets, C and S (in charts 1-3 and 4-6,
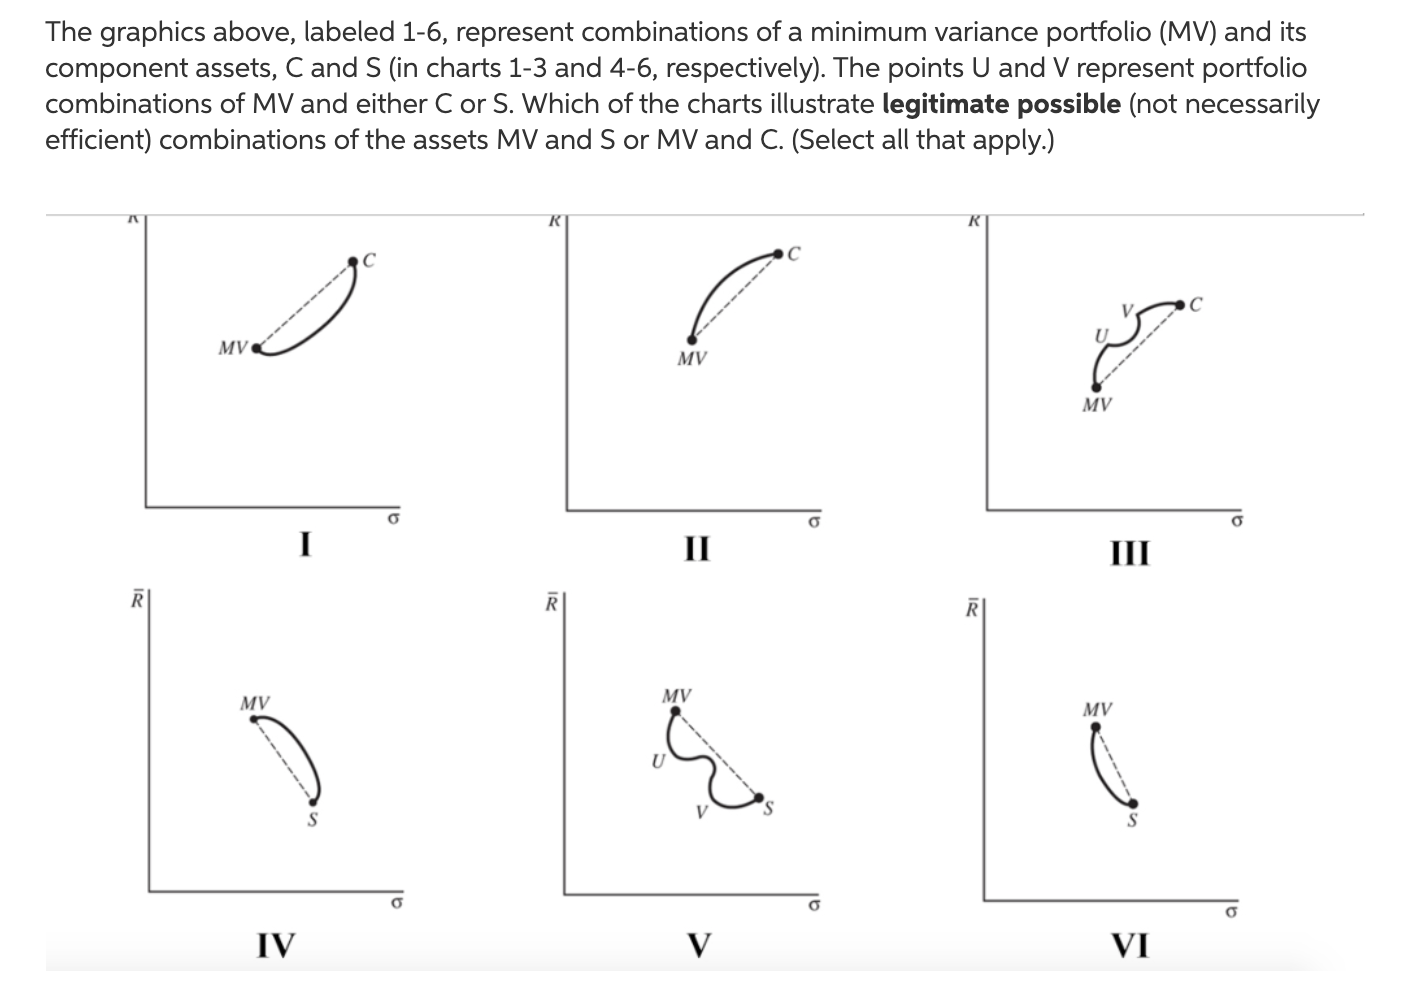
The graphics above, labeled 1-6, represent combinations of a minimum variance portfolio (MV) and its component assets, C and S (in charts 1-3 and 4-6, respectively). The points U and V represent portfolio combinations of MV and either C or S. Which of the charts illustrate legitimate possible (not necessarily efficient) combinations of the assets MV and S or MV and C. (Select all that apply.) R MV MV MV I II III R R MV MV MV 4 U S o 0 IV V VI The graphics above, labeled 1-6, represent combinations of a minimum variance portfolio (MV) and its component assets, C and S (in charts 1-3 and 4-6, respectively). The points U and V represent portfolio combinations of MV and either C or S. Which of the charts illustrate legitimate possible (not necessarily efficient) combinations of the assets MV and S or MV and C. (Select all that apply.) R MV MV MV I II III R R MV MV MV 4 U S o 0 IV V VI
Step by Step Solution
There are 3 Steps involved in it

Get step-by-step solutions from verified subject matter experts