

Question: Tree Growth Coding in R The picture below shows a snipet of tree growth data taken from the spuRs package in R. There are five
Tree Growth Coding in R
The picture below shows a snipet of tree growth data taken from the spuRs package in R. There are five habitats included.
a) Plot tree age versus height for each tree, broken down by habitat type - create a grid of 5 plots, each showing the trees from a single habitat.
b) Write a function that takes a specific habitat and produces that habitat's plot.
habplot = function(num)
{
}
Note this is done in R.
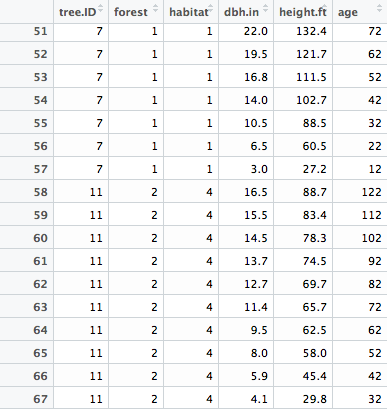
tree.ID forest habitat dbh.in height.ft age 51 52 53 54 22.0132.4 19.5121.7 16.8 111.5 14.0 102.7 10.5 6.5 3.0 16.5 72 62 52 42 32 88.5 60.5 27.2 88.7 83.4 78.3 74.5 69.7 65.7 62.5 58.0 45.4 56 57 58 59 60 12 122 112 102 92 82 72 62 52 42 32 4 4 15.5 4 4 4 62 63 64 65 13.7 12.7 11.4 9.5 8.0 5.9 4 4 4 67 29.8 tree.ID forest habitat dbh.in height.ft age 51 52 53 54 22.0132.4 19.5121.7 16.8 111.5 14.0 102.7 10.5 6.5 3.0 16.5 72 62 52 42 32 88.5 60.5 27.2 88.7 83.4 78.3 74.5 69.7 65.7 62.5 58.0 45.4 56 57 58 59 60 12 122 112 102 92 82 72 62 52 42 32 4 4 15.5 4 4 4 62 63 64 65 13.7 12.7 11.4 9.5 8.0 5.9 4 4 4 67 29.8
Step by Step Solution
There are 3 Steps involved in it

Get step-by-step solutions from verified subject matter experts