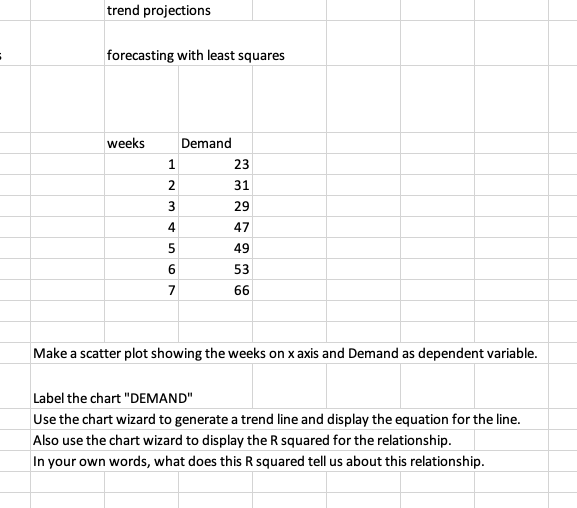
Question: trend projections forecasting with least squares weeks 1 3 Demand 1 23 2 31 3 29 4 47 5 49 6 53 7 66 5

trend projections forecasting with least squares

trend projections forecasting with least squares weeks 1 3 Demand 1 23 2 31 3 29 4 47 5 49 6 53 7 66 5 Make a scatter plot showing the weeks on x axis and Demand as dependent variable. Label the chart "DEMAND" Use the chart wizard to generate a trend line and display the equation for the line. Also use the chart wizard to display the R squared for the relationship. In your own words, what does this Rsquared tell us about this relationship

Step by Step Solution

There are 3 Steps involved in it

1 Expert Approved Answer
Step: 1 Unlock blur-text-image
Question Has Been Solved by an Expert!

Get step-by-step solutions from verified subject matter experts

Step: 2 Unlock
Step: 3 Unlock

Students Have Also Explored These Related General Management Questions!