

Question: Tri Designs, Inc. has the following data: Begin by performing a vertical analysis of Tri Designs' balance sheet for 2024, then perform the analysis
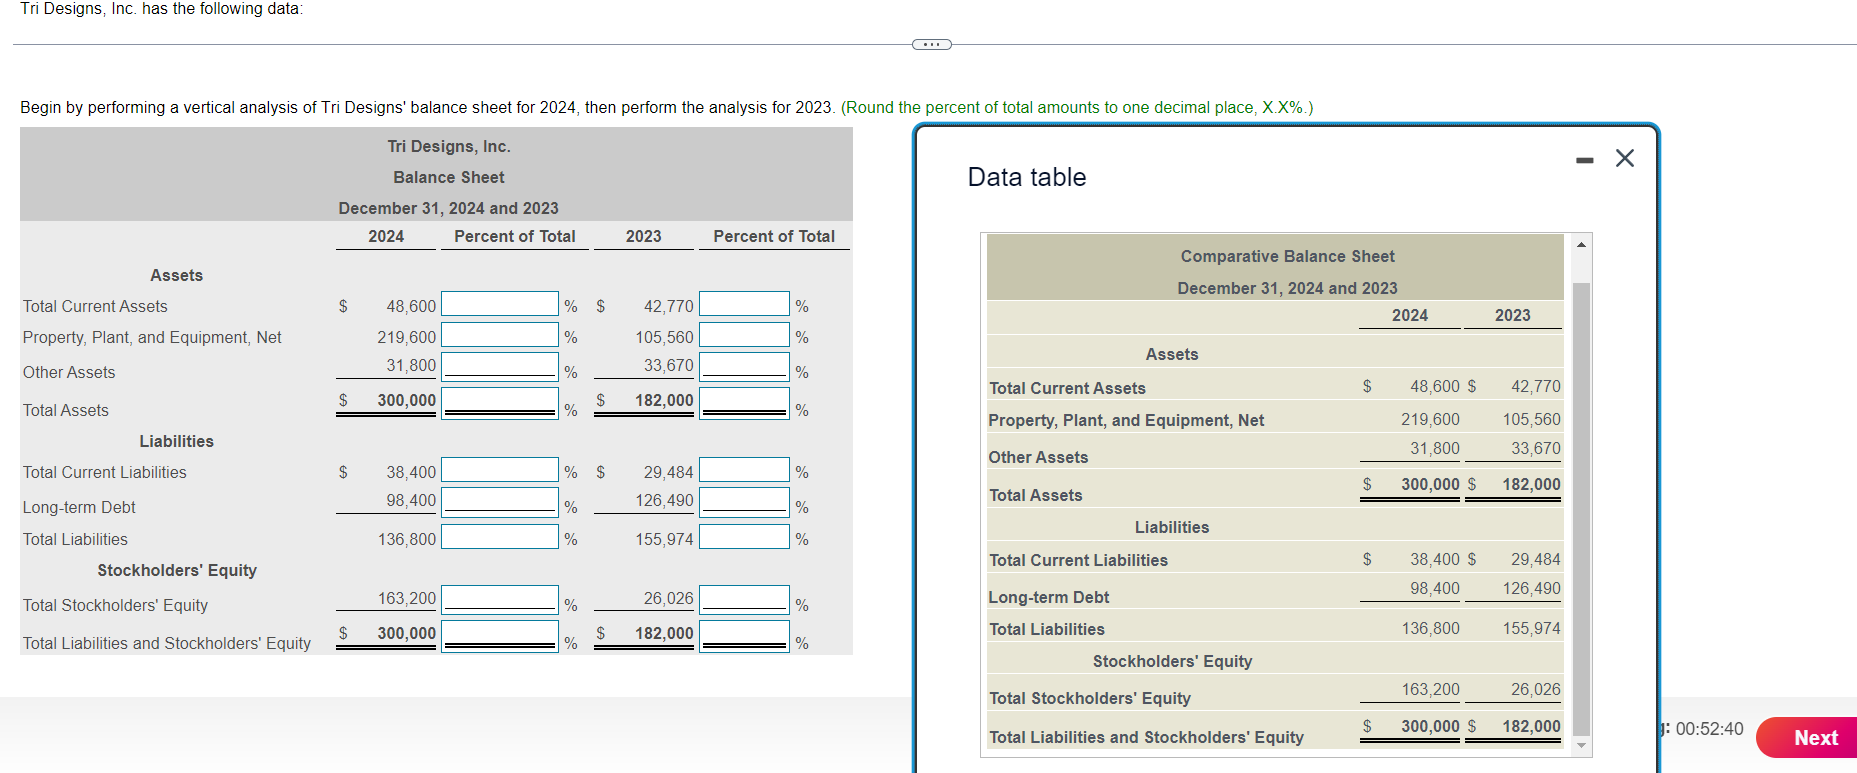
Tri Designs, Inc. has the following data: Begin by performing a vertical analysis of Tri Designs' balance sheet for 2024, then perform the analysis for 2023. (Round the percent of total amounts to one decimal place, X.X%.) Tri Designs, Inc. Balance Sheet December 31, 2024 and 2023 Data table 2024 Percent of Total 2023 Percent of Total - Assets Total Current Assets $ 48,600 Property, Plant, and Equipment, Net 219,600 % $ % 42,770 % Comparative Balance Sheet December 31, 2024 and 2023 2024 2023 105,560 % Assets Other Assets 31,800 33,670 % % Total Current Assets $ 48,600 $ 42,770 $ 300,000 $ 182,000 Total Assets % % Property, Plant, and Equipment, Net Liabilities 219,600 31,800 105,560 33,670 Other Assets Total Current Liabilities $ 38,400 % $ 29,484 % $ 300,000 $ 182,000 Long-term Debt 98,400 126,490 Total Assets % % Liabilities Total Liabilities 136,800 % 155,974 % Total Current Liabilities $ 38,400 $ 29,484 Stockholders' Equity 98,400 126,490 163,200 Total Stockholders' Equity % 26,026 % Long-term Debt $ 300,000 182,000 Total Liabilities 136,800 155,974 Total Liabilities and Stockholders' Equity % % Stockholders' Equity 163,200 26,026 Total Stockholders' Equity $ 300,000 $ 182,000 J: 00:52:40 Total Liabilities and Stockholders' Equity Next
Step by Step Solution
There are 3 Steps involved in it

Get step-by-step solutions from verified subject matter experts