

Question: TRIP DISTRIBUTION a . A production - constrained version of the gravity model has been calibrated using the data collected in 2 0 2 0
TRIP DISTRIBUTION
a A productionconstrained version of the gravity model has been calibrated using the data
collected in The results of this calibration effort reveal that the following friction
factor function ensures that the gravity model fits the observed base year trip "length"
frequency distributions reasonably well:
where
travel time in minutes i to j
for work trips
for nonwork trips
b Work trips and nonwork trips should be distributed using the following work indices and
nonwork indices, respectively, as measures of the "attractiveness" of each zone in the
year
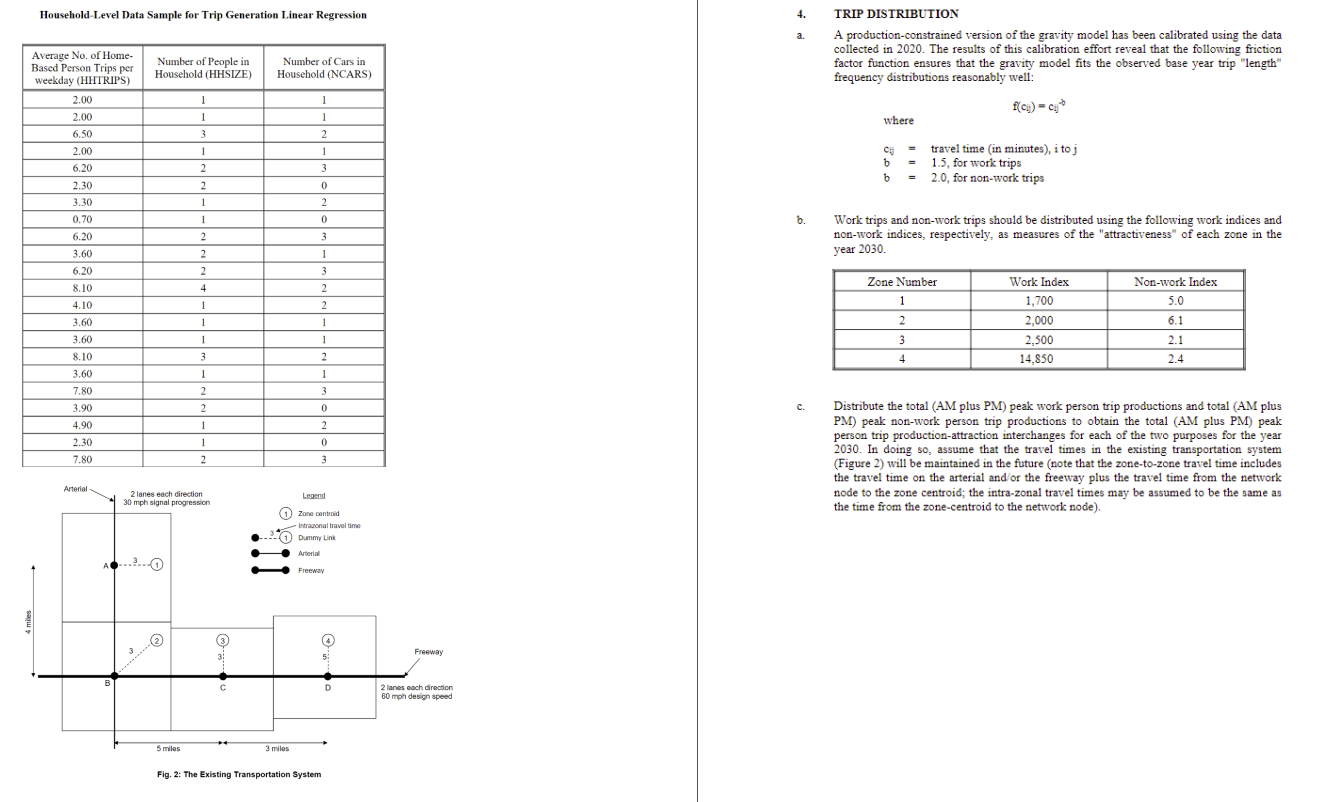
c Distribute the total AM plus PM peak work person trip productions and total AM plus
PM peak nonwork person trip productions to obtain the total AM plus PM peak
person trip productionattraction interchanges for each of the two purposes for the year
In doing so assume that the travel times in the existing transportation system
Figure will be maintained in the future note that the zonetozone travel time includes
the travel time on the arterial andor the freeway plus the travel time from the network
node to the zone centroid; the intrazonal travel times may be assumed to be the same as
the time from the zonecentroid to the network node
solve all parts thanks
Step by Step Solution
There are 3 Steps involved in it
1 Expert Approved Answer
Step: 1 Unlock

Question Has Been Solved by an Expert!
Get step-by-step solutions from verified subject matter experts
Step: 2 Unlock
Step: 3 Unlock