

Question: - trom the horizontal analysis? E9-6 Current position analysis The following data were taken from the comparative balance sheet of Osborn Sisters company for the
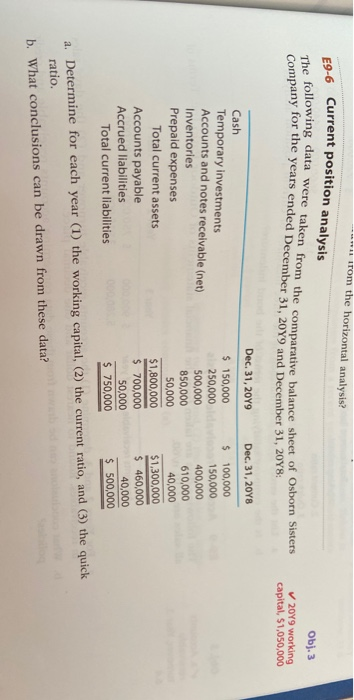
- trom the horizontal analysis? E9-6 Current position analysis The following data were taken from the comparative balance sheet of Osborn Sisters company for the years ended December 31, 2049 and December 31, 2018: urative balance sheet of Osborn Sisters Obj. 3 2049 working capital, $1,050,000 Dec 31, 2019 Dec 31, 2048 $ Cash Temporary investments Accounts and notes receivable (net) Inventories Prepaid expenses Total current assets Accounts payable Accrued liabilities Total current liabilities $ 150,000 250,000 500,000 850,000 50,000 $1,800,000 $ 700,000 50,000 $ 750,000 100,000 150,000 400,000 610,000 40,000 $1,300,000 $ 460,000 40,000 $ 500,000 2. Determine for each year (1) the working capital, (2) the current ratio, and (3) the quick ratio. b. What conclusions can be drawn from these data
Step by Step Solution
There are 3 Steps involved in it

Get step-by-step solutions from verified subject matter experts