

Question: True or False: Based on the information in the table below, between now and the next six months the US Dollar is expected to depreciate
True or False:
Based on the information in the table below, between now and the next six months the US Dollar is expected to depreciate against the Australian dollar. T/F
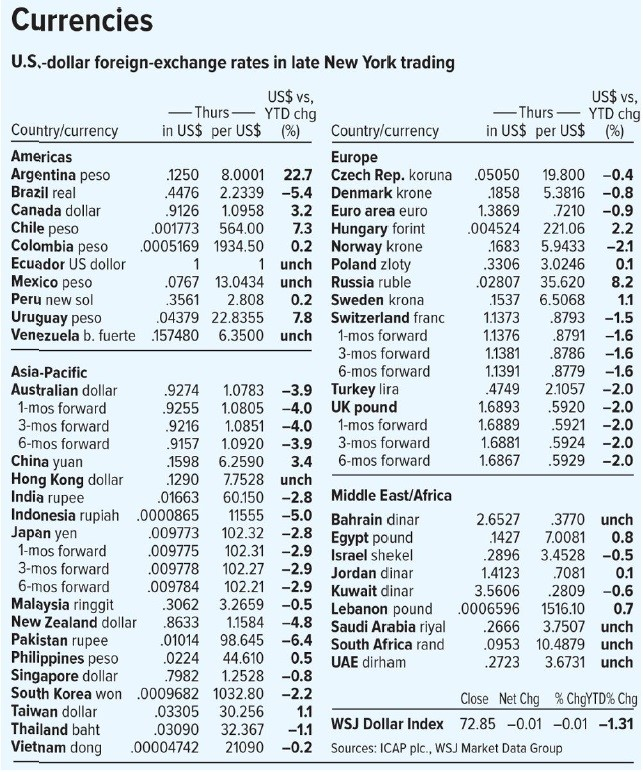
Currencies U.S.-dollar foreign-exchange rates in late New York trading US$ vs, -Thurs YTD chg in US$ per US$ (%) US$ vs, Thurs YTD chg Country/currency in US$ per US$ %) Americas Argentina peso .1250 8.0001 22.7 Brazil real .4476 2.2339 -5.4 Canada dollar .9126 1.0958 3.2 Chile peso .001773 564.00 7.3 Colombia peso .0005169 1934.50 0.2 Ecuador US dollor 1 1 unch Mexico peso 0767 13.0434 unch Peru new sol 3561 2.808 0.2 Uruguay peso .04379 22.83557.8 Venezuela b. fuerte 157480 6.3500 unch -0.4 -0.8 -0.9 2.2 -2.1 0.1 8.2 Country/currency Europe Czech Rep. koruna Denmark krone Euro area euro Hungary forint Norway Krone Poland zloty Russia ruble Sweden krona Switzerland franc 1-mos forward 3-mos forward 6-mos forward Turkey lira UK pound 1-mos forward 3-mos forward 6-mos forward .05050 1858 1.3869 004524 .1683 .3306 .02807 1537 1.1373 1.1376 1.1381 1.1391 4749 1.6893 1.6889 1.6881 1.6867 19.800 5.3816 7210 221.06 5.9433 3.0246 35.620 6.5068 .8793 8791 .8786 .8779 2.1057 .5920 .5921 5924 .5929 -1.5 -1.6 -1.6 -1.6 -2.0 -2.0 -2.0 -2.0 Asia-Pacific Australian dollar .9274 1.0783 -3.9 1-mos forward .9255 1.0805 -4.0 3-mos forward .9216 1.0851 -4.0 6-mos forward .9157 1.0920 -3.9 China yuan .1598 6.2590 3.4 Hong Kong dollar .1290 7.7528 unch India rupee .01663 60.150 -2.8 Indonesia rupiah .0000865 11555 -5.0 Japan yen .009773 102.32 -2.8 1-mos forward .009775 102.31 -2.9 3-mos forward .009778 102.27 -2.9 6-mos forward .009784 102.21 -2.9 Malaysia ringgit 3062 3.2659 -0.5 New Zealand dollar 8633 1.1584 -4.8 Pakistan rupee .0101498.645 -6.4 Philippines peso .0224 44.610 0.5 Singapore dollar .7982 1.2528 -0.8 South Korea won .0009682 1032.80 -2.2 Taiwan dollar .03305 30.256 1.1 Thailand baht .03090 32.367 -1.1 Vietnam dong .00004742 21090 -0.2 Middle East/Africa Bahrain dinar 2.6527 3770 unch Egypt pound .1427 7.0081 0.8 Israel shekel .2896 3.4528 -0.5 Jordan dinar 1.4123 7081 0.1 Kuwait dinar 3.5606 2809 -0.6 Lebanon pound .0006596 1516.10 0.7 Saudi Arabia riyal 2666 3.7507 unch South Africa rand .0953 10.4879 unch UAE dirham .2723 3.6731 unch Close Net Chg %ChgYTD%Chg WSJ Dollar Index 72.85 -0.01 -0.01 -1.31 Sources: ICAP plc., WSJ Market Data Group
Step by Step Solution
There are 3 Steps involved in it

Get step-by-step solutions from verified subject matter experts