

Question: True or false. the process data is in statistical control? 40 35 8. A process control chart is shown below. The yellow line is the
True or false. the process data is in statistical control? 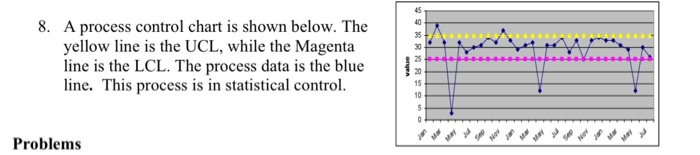
Step by Step Solution
There are 3 Steps involved in it
1 Expert Approved Answer
Step: 1 Unlock

Question Has Been Solved by an Expert!
Get step-by-step solutions from verified subject matter experts
Step: 2 Unlock
Step: 3 Unlock