

Question: try the most appropriate graphical display for the data, and (2) identify the most appropriate statistic (numeric summary). No explanations and no drawings of graphs
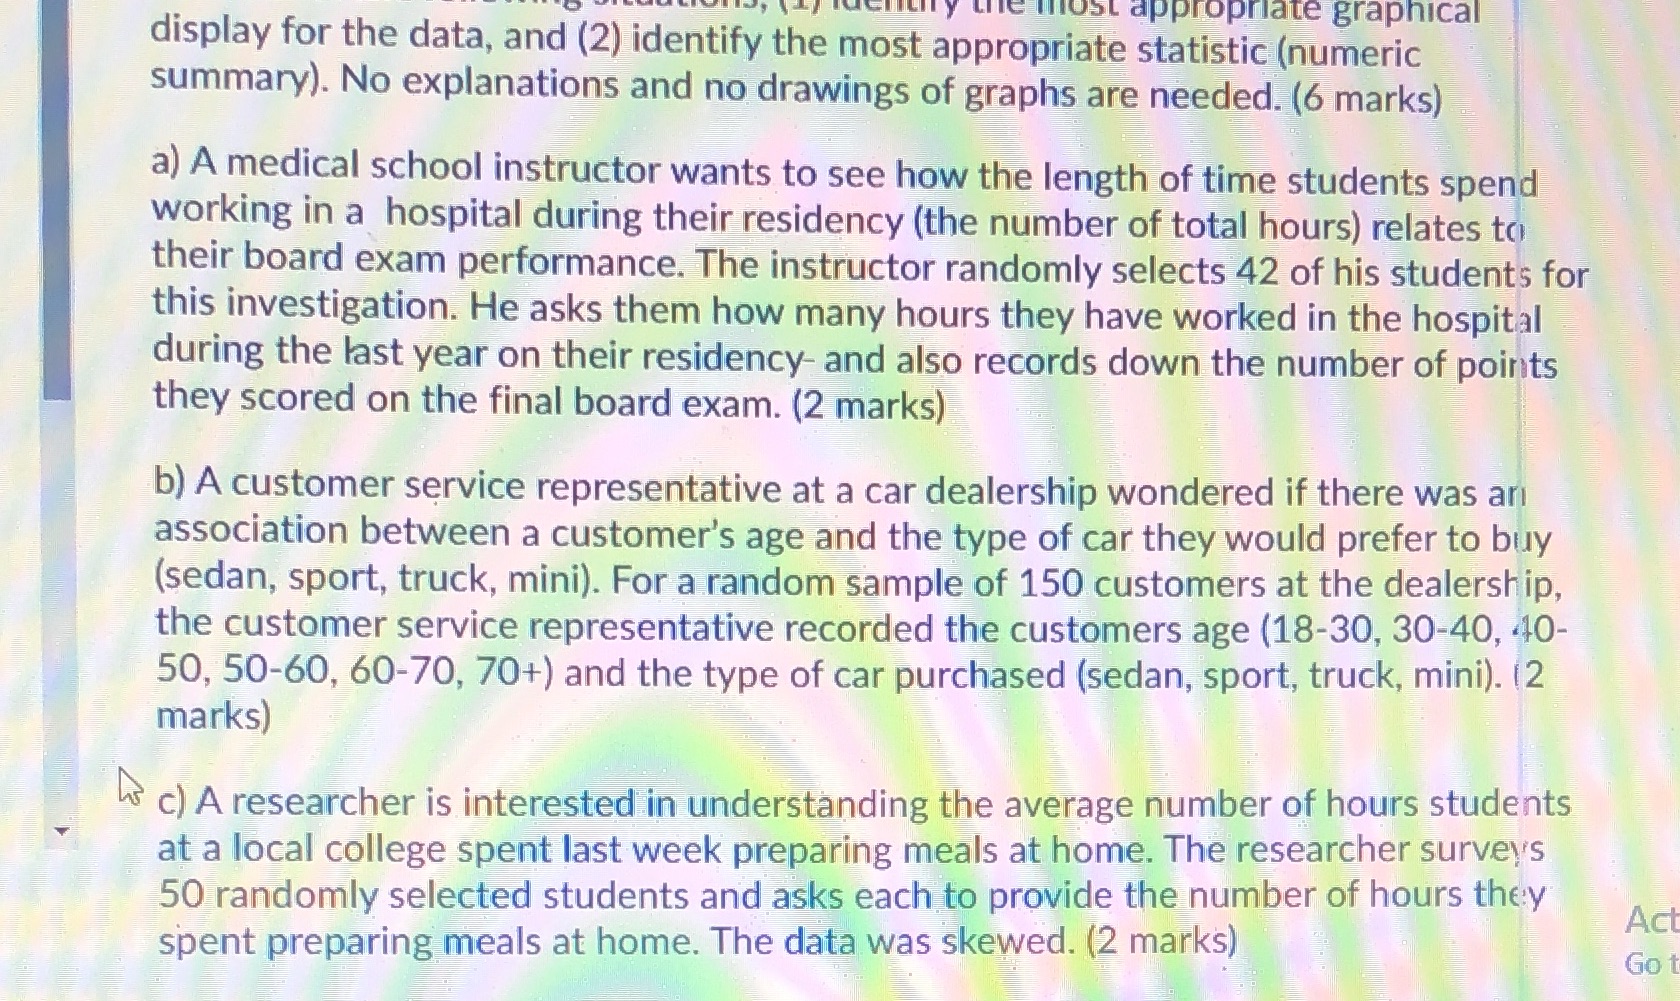
try the most appropriate graphical display for the data, and (2) identify the most appropriate statistic (numeric summary). No explanations and no drawings of graphs are needed. (6 marks) a) A medical school instructor wants to see how the length of time students spend working in a hospital during their residency (the number of total hours) relates to their board exam performance. The instructor randomly selects 42 of his students for this investigation. He asks them how many hours they have worked in the hospital during the last year on their residency- and also records down the number of points they scored on the final board exam. (2 marks) b) A customer service representative at a car dealership wondered if there was ari association between a customer's age and the type of car they would prefer to buy (sedan, sport, truck, mini). For a random sample of 150 customers at the dealership, the customer service representative recorded the customers age (18-30, 30-40, 40- 50, 50-60, 60-70, 70+) and the type of car purchased (sedan, sport, truck, mini). (2 marks) "s c) A researcher is interested in understanding the average number of hours students at a local college spent last week preparing meals at home. The researcher surveys 50 randomly selected students and asks each to provide the number of hours they Act spent preparing meals at home. The data was skewed. (2 marks) Go t
Step by Step Solution
There are 3 Steps involved in it

Get step-by-step solutions from verified subject matter experts