

Question: Trying to do a scatter plot in Processing. Directions : The provided data are statistics about the top 12 NBA basketball players in the MVP
Trying to do a scatter plot in Processing.
Directions:
The provided data are statistics about the top 12 NBA basketball players in the MVP poll for the 2014-2015 season.
http://www.basketball-reference.com/awards/awards_2015.html?lid=header_awards
Use the labelXAxis () and labelYAxis ( ) methods to label the vertical and horizontal axes of your graph with the columns you will be using.
Inside the for loop, add your own code to:
a. Get the columns of nbaData you need for row i. One column will be X (Player's Last Name), one will be Y (PTS - or Points Per Game).
b. Convert those Strings to floats see the example in the comments near the top of the sketch
c. Use the map ( ) method to scale the values so they will fit and be visible on your Display window. Check the Processing reference web page to see how map ( ) works.
d. Tell Processing to draw an ellipse at the XY position to represent that point on the graph.
e. Use println ( ) to dump your data as text in the text area at the bottom of the Processing window. This will really help with debugging your code.
.
.
.
Here's what I have so far:
String [][] nbaData = { // Columns go across, rows go down. Each is numbered starting from 0 // 0 1 2 3 4 5 6 7 8 9 10 11 12 13 14 15 16 17 18 19 20 /* 0 */ { "Rank","PlayerFname","PlayerLname", "Age","Tm","First","PtsWon","PtsMax","Share","G","MP","PTS","TRB","AST","STL","BLK","FG%","3P%","FT%","WS","WS/48" }, /* 1 */ { "1","Stephen","Curry","26","GSW","100.0","1198.0","1300","0.922","80","32.7","23.8","4.3","7.7","2.0","0.2",".487",".443",".914","15.7",".288" }, /* 2 */ { "2","James","Harden","25","HOU","25.0","936.0","1300","0.720","81","36.8","27.4","5.7","7.0","1.9","0.7",".440",".375",".868","16.4",".265" }, /* 3 */ { "3","LeBron","James","30","CLE","5.0","552.0","1300","0.425","69","36.1","25.3","6.0","7.4","1.6","0.7",".488",".354",".710","10.4",".199" }, /* 4 */ { "4","Russell","Westbrook","26","OKC","0.0","352.0","1300","0.271","67","34.4","28.1","7.3","8.6","2.1","0.2",".426",".299",".835","10.6",".222" }, /* 5 */ { "5","Anthony","Davis","21","NOP","0.0","203.0","1300","0.156","68","36.1","24.4","10.2","2.2","1.5","2.9",".535",".083",".805","14.0",".274" }, /* 6 */ { "6","Chris","Paul","29","LAC","0.0","124.0","1300","0.095","82","34.8","19.1","4.6","10.2","1.9","0.2",".485",".398",".900","16.1",".270" }, /* 7 */ { "7","LaMarcus","Aldridge","29","POR","0.0","6.0","1300","0.005","71","35.4","23.4","10.2","1.7","0.7","1.0",".466",".352",".845","8.6",".165" }, /* 8 */ { "9T","Marc","Gasol","30","MEM","0.0","3.0","1300","0.002","81","33.2","17.4","7.8","3.8","0.9","1.6",".494",".176",".795","10.2",".182" }, /* 9 */ { "9T","Blake","Griffin","25","LAC","0.0","3.0","1300","0.002","67","35.2","21.9","7.6","5.3","0.9","0.5",".502",".400",".728","9.0",".183" }, /* 10 */ { "12T","Tim","Duncan","38","SAS","0.0","1.0","1300","0.001","77","28.9","13.9","9.1","3.0","0.8","2.0",".512",".286",".740","9.6",".207" }, /* 11 */ { "12T","Kawhi","Leonard","23","SAS","0.0","1.0","1300","0.001","64","31.8","16.5","7.2","2.5","2.3","0.8",".479",".349",".802","8.6",".204" }, /* 12 */ { "12T","Klay","Thompson","24","GSW","0.0","1.0","1300","0.001","77","31.9","21.7","3.2","2.9","1.1","0.8",".463",".439",".879","8.8",".172" } } ;
int height = 800; int width = 800;
void labelXAxis ( String title ) { text ( title, (width / 2) - ( title.length ( ) / 2 ), 10 ) ; } // end labelXAxis ( )
void labelYAxis ( String title ) { pushMatrix(); translate(10,height/2); rotate(HALF_PI); text(title,0,0); popMatrix(); }
void setup ( ) { size (800, 800); background (100) ; noLoop ( ) ;
labelXAxis ("Games Played"); labelYAxis ("Points Per Game"); //**** Start your loop at 1 for ( int row = 1 ; row
//**** (2) convert those Strings to floats (I'm not sure if I did this correctly, or if this needs to be corrected.)
float(nbaData[1][9]); float(nbaData[1][11]);
float(nbaData[2][9]); float(nbaData[2][11]);
float(nbaData[3][9]); float(nbaData[3][11]);
float(nbaData[4][9]); float(nbaData[4][11]);
float(nbaData[5][9]); float(nbaData[5][11]);
float(nbaData[6][9]); float(nbaData[6][11]);
float(nbaData[7][9]); float(nbaData[7][11]);
float(nbaData[8][9]); float(nbaData[8][11]);
float(nbaData[9][9]); float(nbaData[9][11]);
float(nbaData[10][9]); float(nbaData[10][11]);
float(nbaData[11][9]); float(nbaData[11][11]);
float(nbaData[12][9]); float(nbaData[11][11]);
//**** (3) use the map ( ) method to scale the values so they will fit //**** and be visible on your Display window (Not sure how to do this part, but I'd like Games Played range //**** from minimum 65 to maximum 90 and the PTS range from 15-30.)
//**** (4) Tell Processing to draw some shape, or line, or point at XY to represent that point on the graph. (I'd like to draw //**** small 10px by 10px ellipses filled with random colors.
//**** (5) use println ( ) to show your data as text in the text area for debugging.
Eventually, I'd like the scatter plot to not look exactly the same, but similar to:
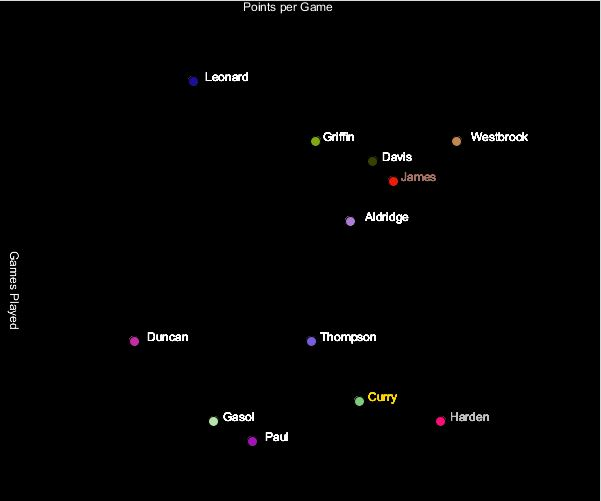
Points per Game Leonard Westbrook Davis ? James Aldridge Duncan Thompson Curry Gasol Harden Paul
Step by Step Solution
There are 3 Steps involved in it

Get step-by-step solutions from verified subject matter experts