

Question: ( Trying to do this in MATLAB and struggling ) Extra Credit: Simulation of Mobility Models ( 2 0 points ) . Assume that a
Trying to do this in MATLAB and strugglingExtra Credit: Simulation of Mobility Models points Assume that a x grid cell is used
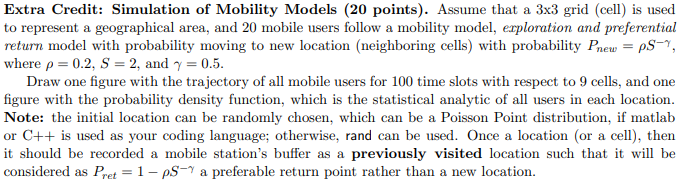
to represent a geographical area, and mobile users follow a mobility model, exploration and preferential
return model with probability moving to new location neighboring cells with probability
where and
Draw one figure with the trajectory of all mobile users for time slots with respect to cells, and one
figure with the probability density function, which is the statistical analytic of all users in each location.
Note: the initial location can be randomly chosen, which can be a Poisson Point distribution, if matlab
or is used as your coding language; otherwise, rand can be used. Once a location or a cell then
it should be recorded a mobile station's buffer as a previously visited location such that it will be
considered as a preferable return point rather than a new location.
Step by Step Solution
There are 3 Steps involved in it
1 Expert Approved Answer
Step: 1 Unlock

Question Has Been Solved by an Expert!
Get step-by-step solutions from verified subject matter experts
Step: 2 Unlock
Step: 3 Unlock