

Question: TS 0 a Question 3 Using the next five years of free cash flows computed in Question 1. an estimated continuing value at the end
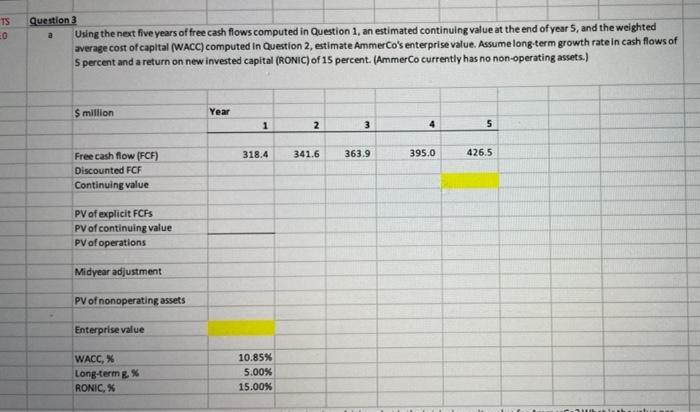
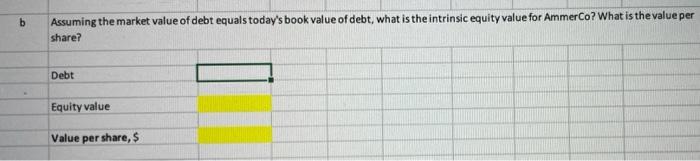
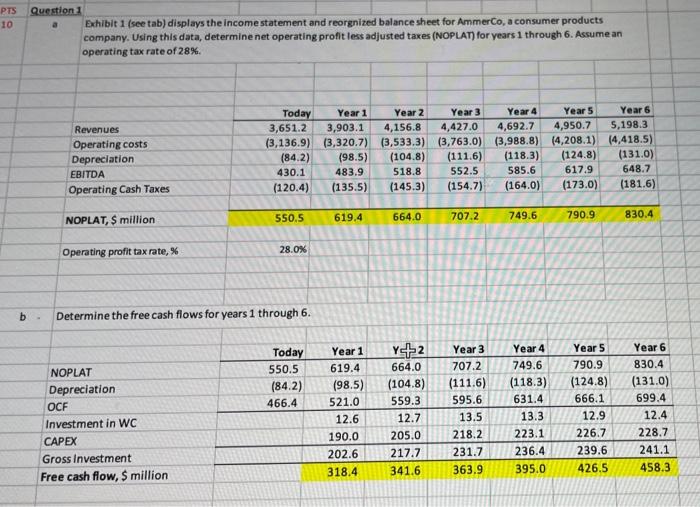
TS 0 a Question 3 Using the next five years of free cash flows computed in Question 1. an estimated continuing value at the end of years, and the weighted average cost of capital (WACC) computed in Question 2, estimate AmmerCo's enterprise value. Assume long-term growth rate in cash flows of S percent and a return on new invested capital (RONIC) of 15 percent. (AmmerCo currently has no non-operating assets.) $ million Year 1 2 3 4 5 318.4 341.6 363.9 395.0 426.5 Free cash flow (FCF) Discounted FCF Continuing value PV of explicit FCBS PV of continuing value PV of operations Midyear adjustment PV of nonoperating assets Enterprise value WACC, X Long-term g % RONIC, 10.85% 5.00% 15.00% b Assuming the market value of debt equals today's book value of debt, what is the intrinsic equity value for Ammer Co? What is the value per share? Debt Equity value Value per share, $ PTS 10 Question 1 Exhibit 1 (see tab) displays the income statement and reorgnized balance sheet for AmmerCo, a consumer products company. Using this data, determine net operating profit less adjusted taxes (NOPLAT) for years 1 through 6. Assume an operating tax rate of 28%. Revenues Operating costs Depreciation EBITDA Operating Cash Taxes Today 3,651.2 (3,136.9) (84.2) 430.1 (120.4) Year 1 3,903.1 (3,320.7) (98.5) 483.9 (135.5) Year 2 Year 3 Year 4 Year 5 4,156.8 4,427.0 4,692.7 4,950.7 (3,533.3) (3,763.0) (3,988.8) (4,208.1) (104.8) (111.6) (118.3) (124.8) 518.8 552.5 585.6 617.9 (145.3) (154.7) (164.0) (173.0) Year 6 5,198.3 (4,418.5) (131.0) 648.7 (181.6) 550.5 619.4 664.0 NOPLAT, $ million 707.2 749.6 790.9 830.4 Operating profit tax rate, % 28.0% b Determine the free cash flows for years 1 through 6. Today 550.5 (84.2) 466.4 NOPLAT Depreciation OCF Investment in WC CAPEX Gross Investment Free cash flow, $ million Year 1 619.4 (98.5) 521.0 12.6 190.0 202.6 318.4 Y+2 664.0 (104.8) 559.3 12.7 205.0 217.7 341.6 Year 3 707.2 (111.6) 595.6 13.5 218.2 231.7 363.9 Year 4 749.6 (118.3) 631.4 13.3 223.1 236.4 395.0 Year 5 790.9 (124.8) 666.1 12.9 226.7 239.6 426.5 Year 6 830.4 (131.0) 699.4 12.4 228.7 241.1 458.3
Step by Step Solution
There are 3 Steps involved in it

Get step-by-step solutions from verified subject matter experts