

Question: TTA200 Tutorial Sheet 4 - Component failure models. Question 1: From the table, which contains the mortality data of an original sample of 1,023,102 people,
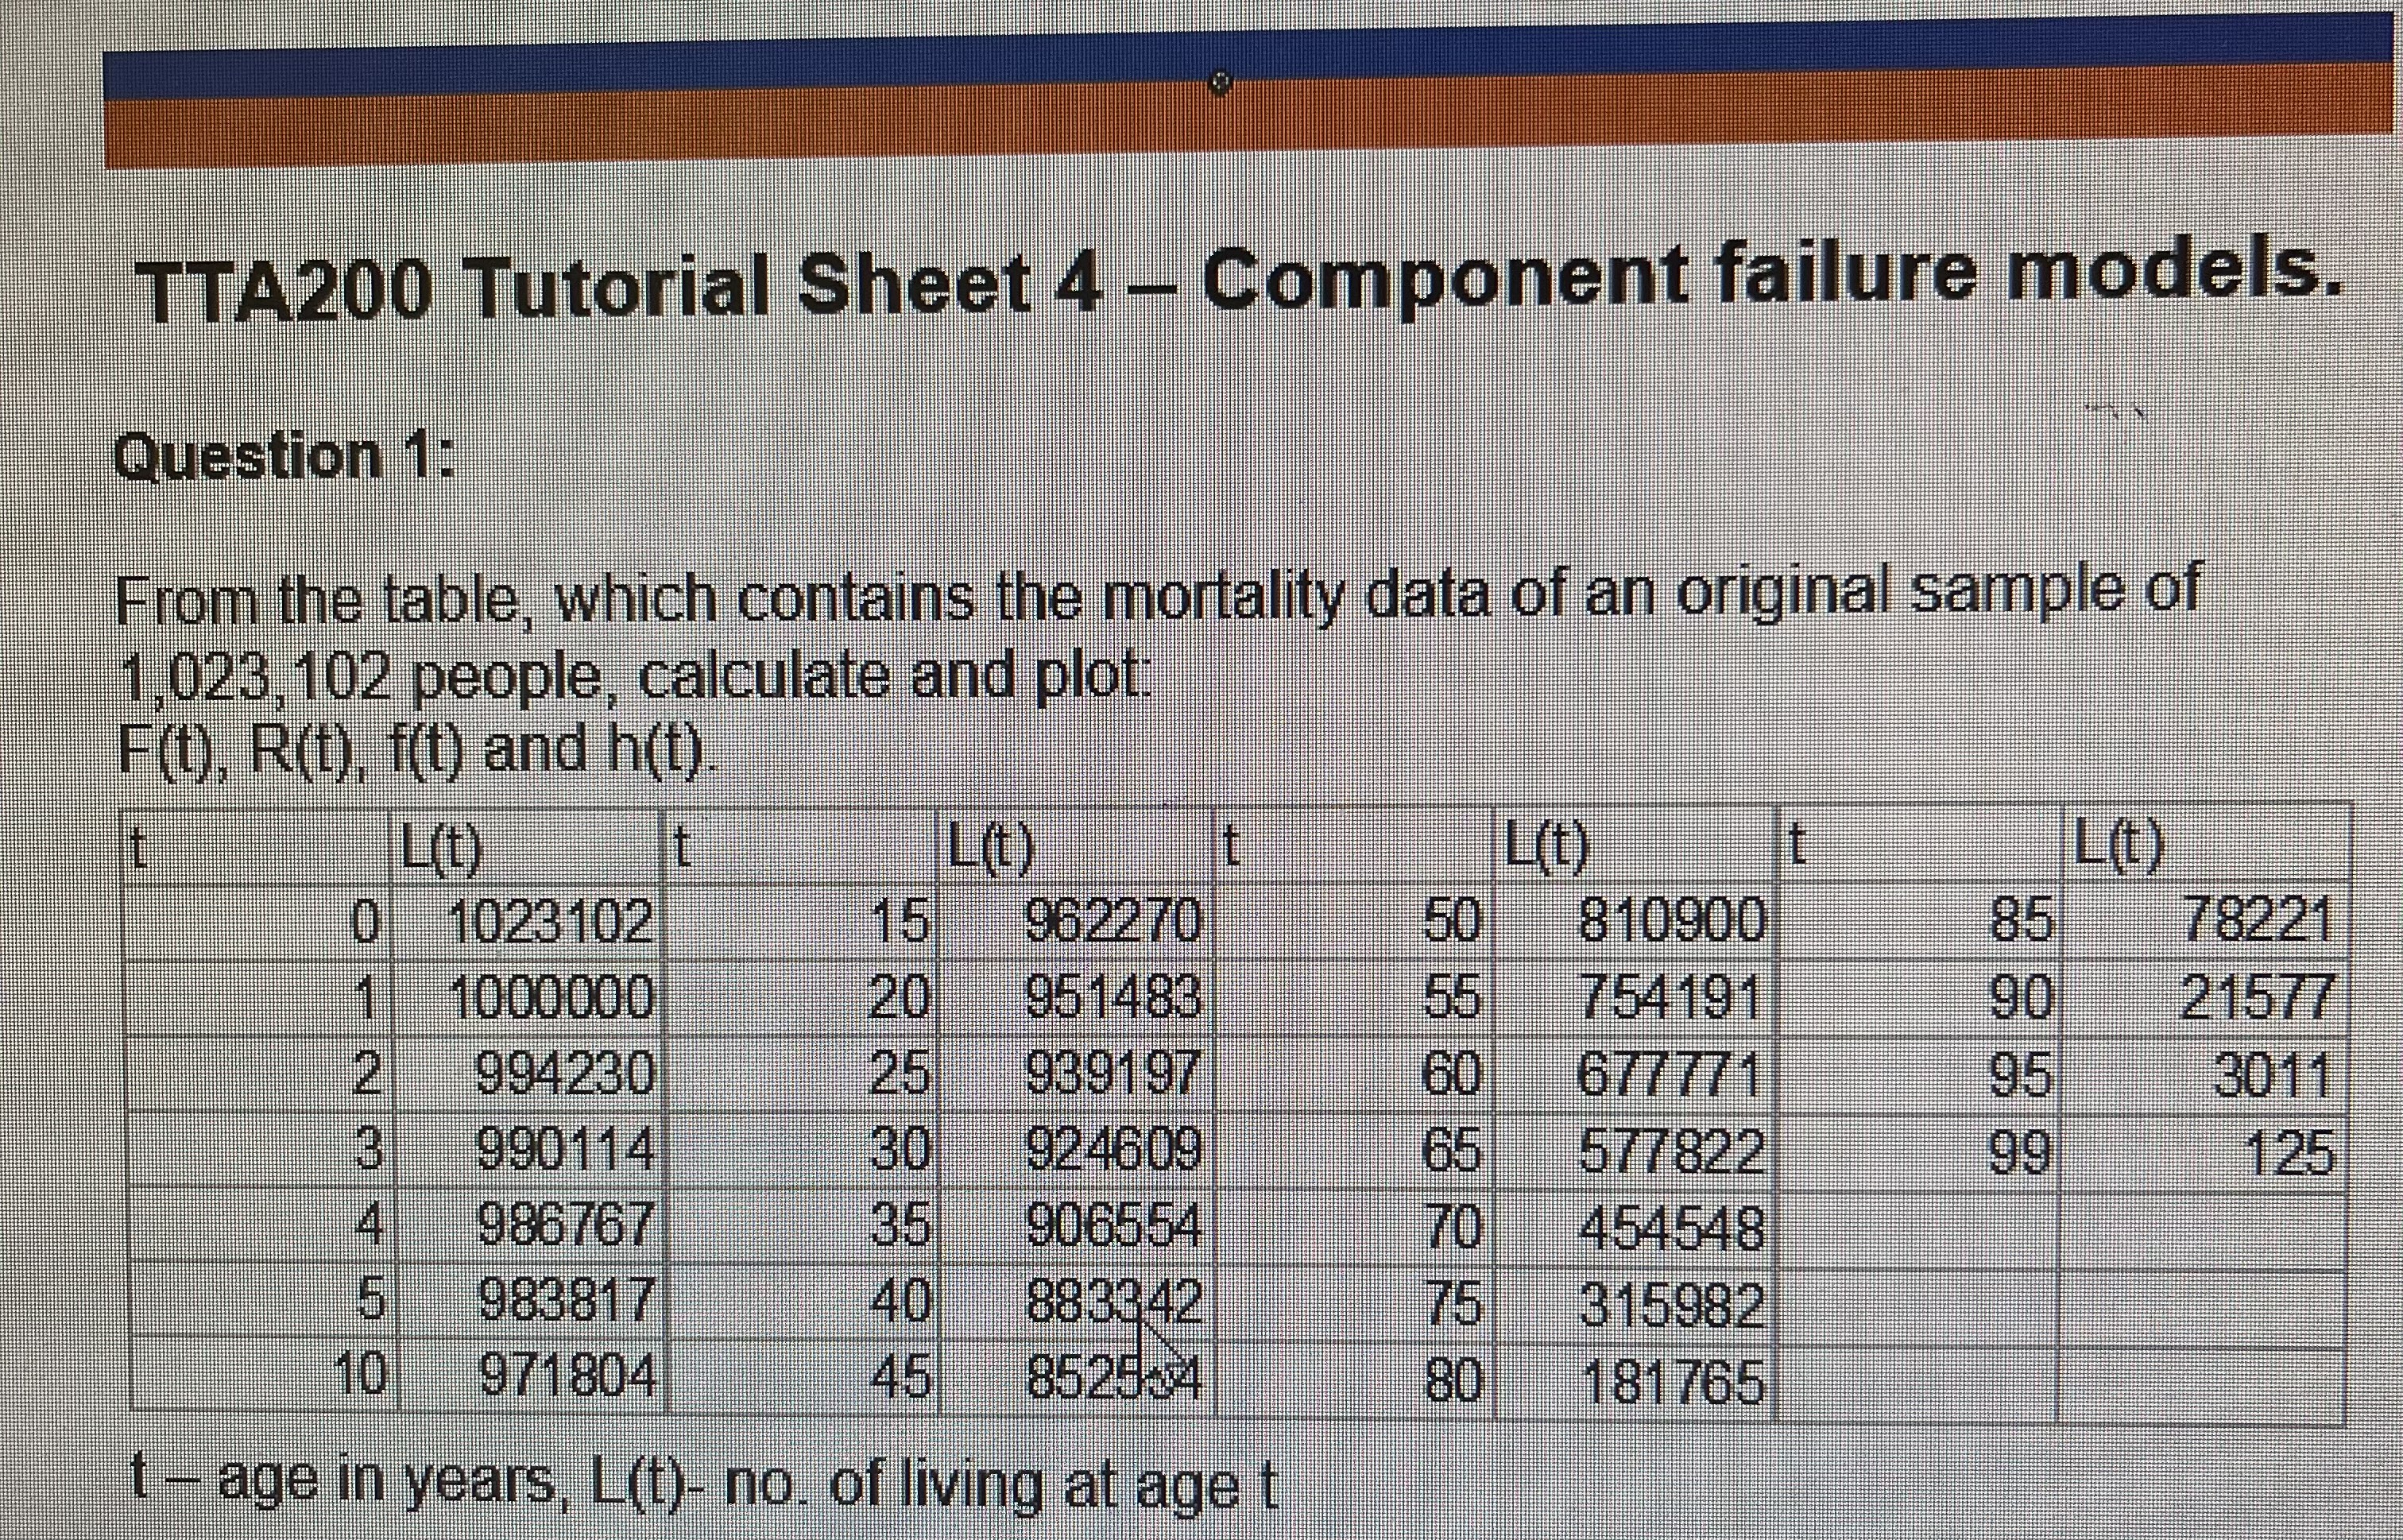
TTA200 Tutorial Sheet 4 - Component failure models. Question 1: From the table, which contains the mortality data of an original sample of 1,023,102 people, calculate and plot: F(1), R(1), f(t) and h(t) L(t) L(!) L(t) L(t) 0 1023102 15 962270 50 810900 85 78221 1000000 20 951483 55 754191 90 21577 2 994230 25 939197 60 677771 95 3011 3 990114 30 924609 65 577822 99 125 4 986767 35 906554 70 454548 5 983817 40 883342 75 315982 10 971804 45 852534 80 181765 t - age in years, L(t)- no. of living at age t
Step by Step Solution
There are 3 Steps involved in it
1 Expert Approved Answer
Step: 1 Unlock

Question Has Been Solved by an Expert!
Get step-by-step solutions from verified subject matter experts
Step: 2 Unlock
Step: 3 Unlock