

Question: T-Test One-Sample Statistics N Mean Std. Deviation Std. Error Mean WeightChange 43 -8.564651163 5.5349621880 .84407382052 One-Sample Test Test Value = -8 95% Confidence Interval of
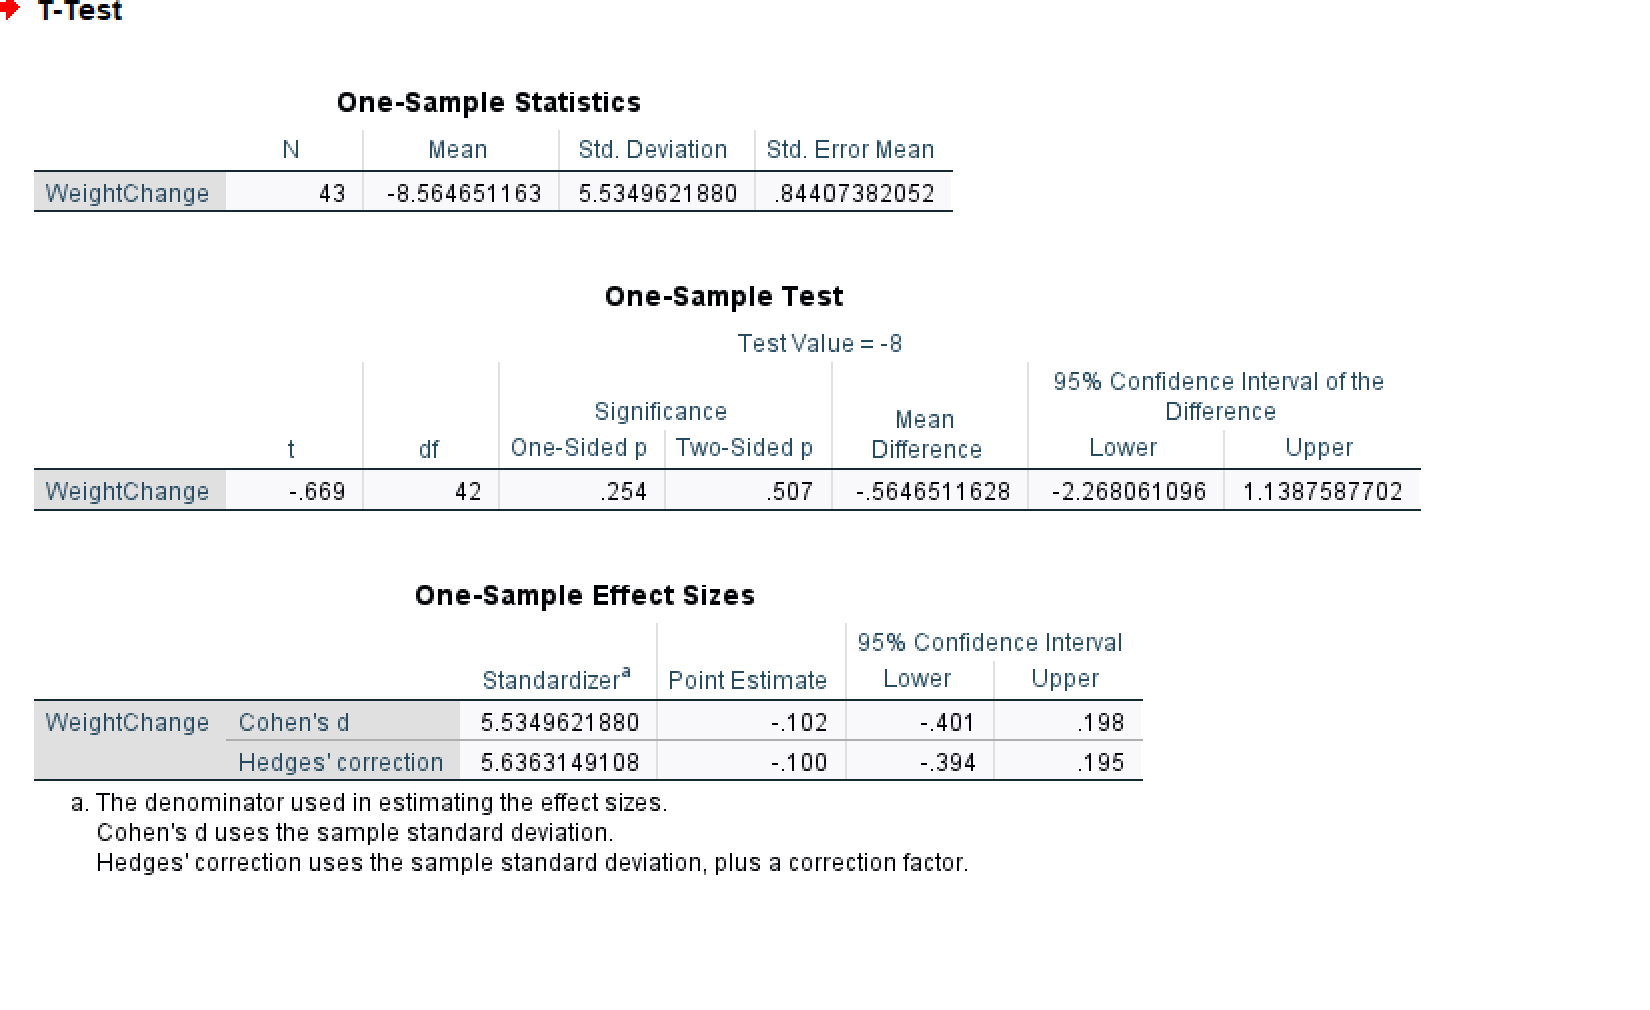
T-Test One-Sample Statistics N Mean Std. Deviation Std. Error Mean WeightChange 43 -8.564651163 5.5349621880 .84407382052 One-Sample Test Test Value = -8 95% Confidence Interval of the Significance Mean Difference df One-Sided p Two-Sided p Difference Lower Upper WeightChange -.669 42 .254 507 -.5646511628 -2.268061096 1.1387587702 One-Sample Effect Sizes 95% Confidence Interval Standardizera Point Estimate Lower Upper WeightChange Cohen's d 5.5349621880 -.102 -.401 198 Hedges' correction 5.6363149108 -.100 -.394 195 a. The denominator used in estimating the effect sizes. Cohen's d uses the sample standard deviation. Hedges' correction uses the sample standard deviation, plus a correction factor
Step by Step Solution
There are 3 Steps involved in it

Get step-by-step solutions from verified subject matter experts