

Question: ttitude_hw (2).sav [DataSet1] - IBM SPSS Statistics Data Editor View Data Transform Analyze Graphs Utilities Extensions Window Help Q Name Type Width Decimals Label Values
![ttitude_hw (2).sav [DataSet1] - IBM SPSS Statistics Data Editor View Data](https://s3.amazonaws.com/si.experts.images/answers/2024/07/6687abe6c4f49_3986687abe697f58.jpg)
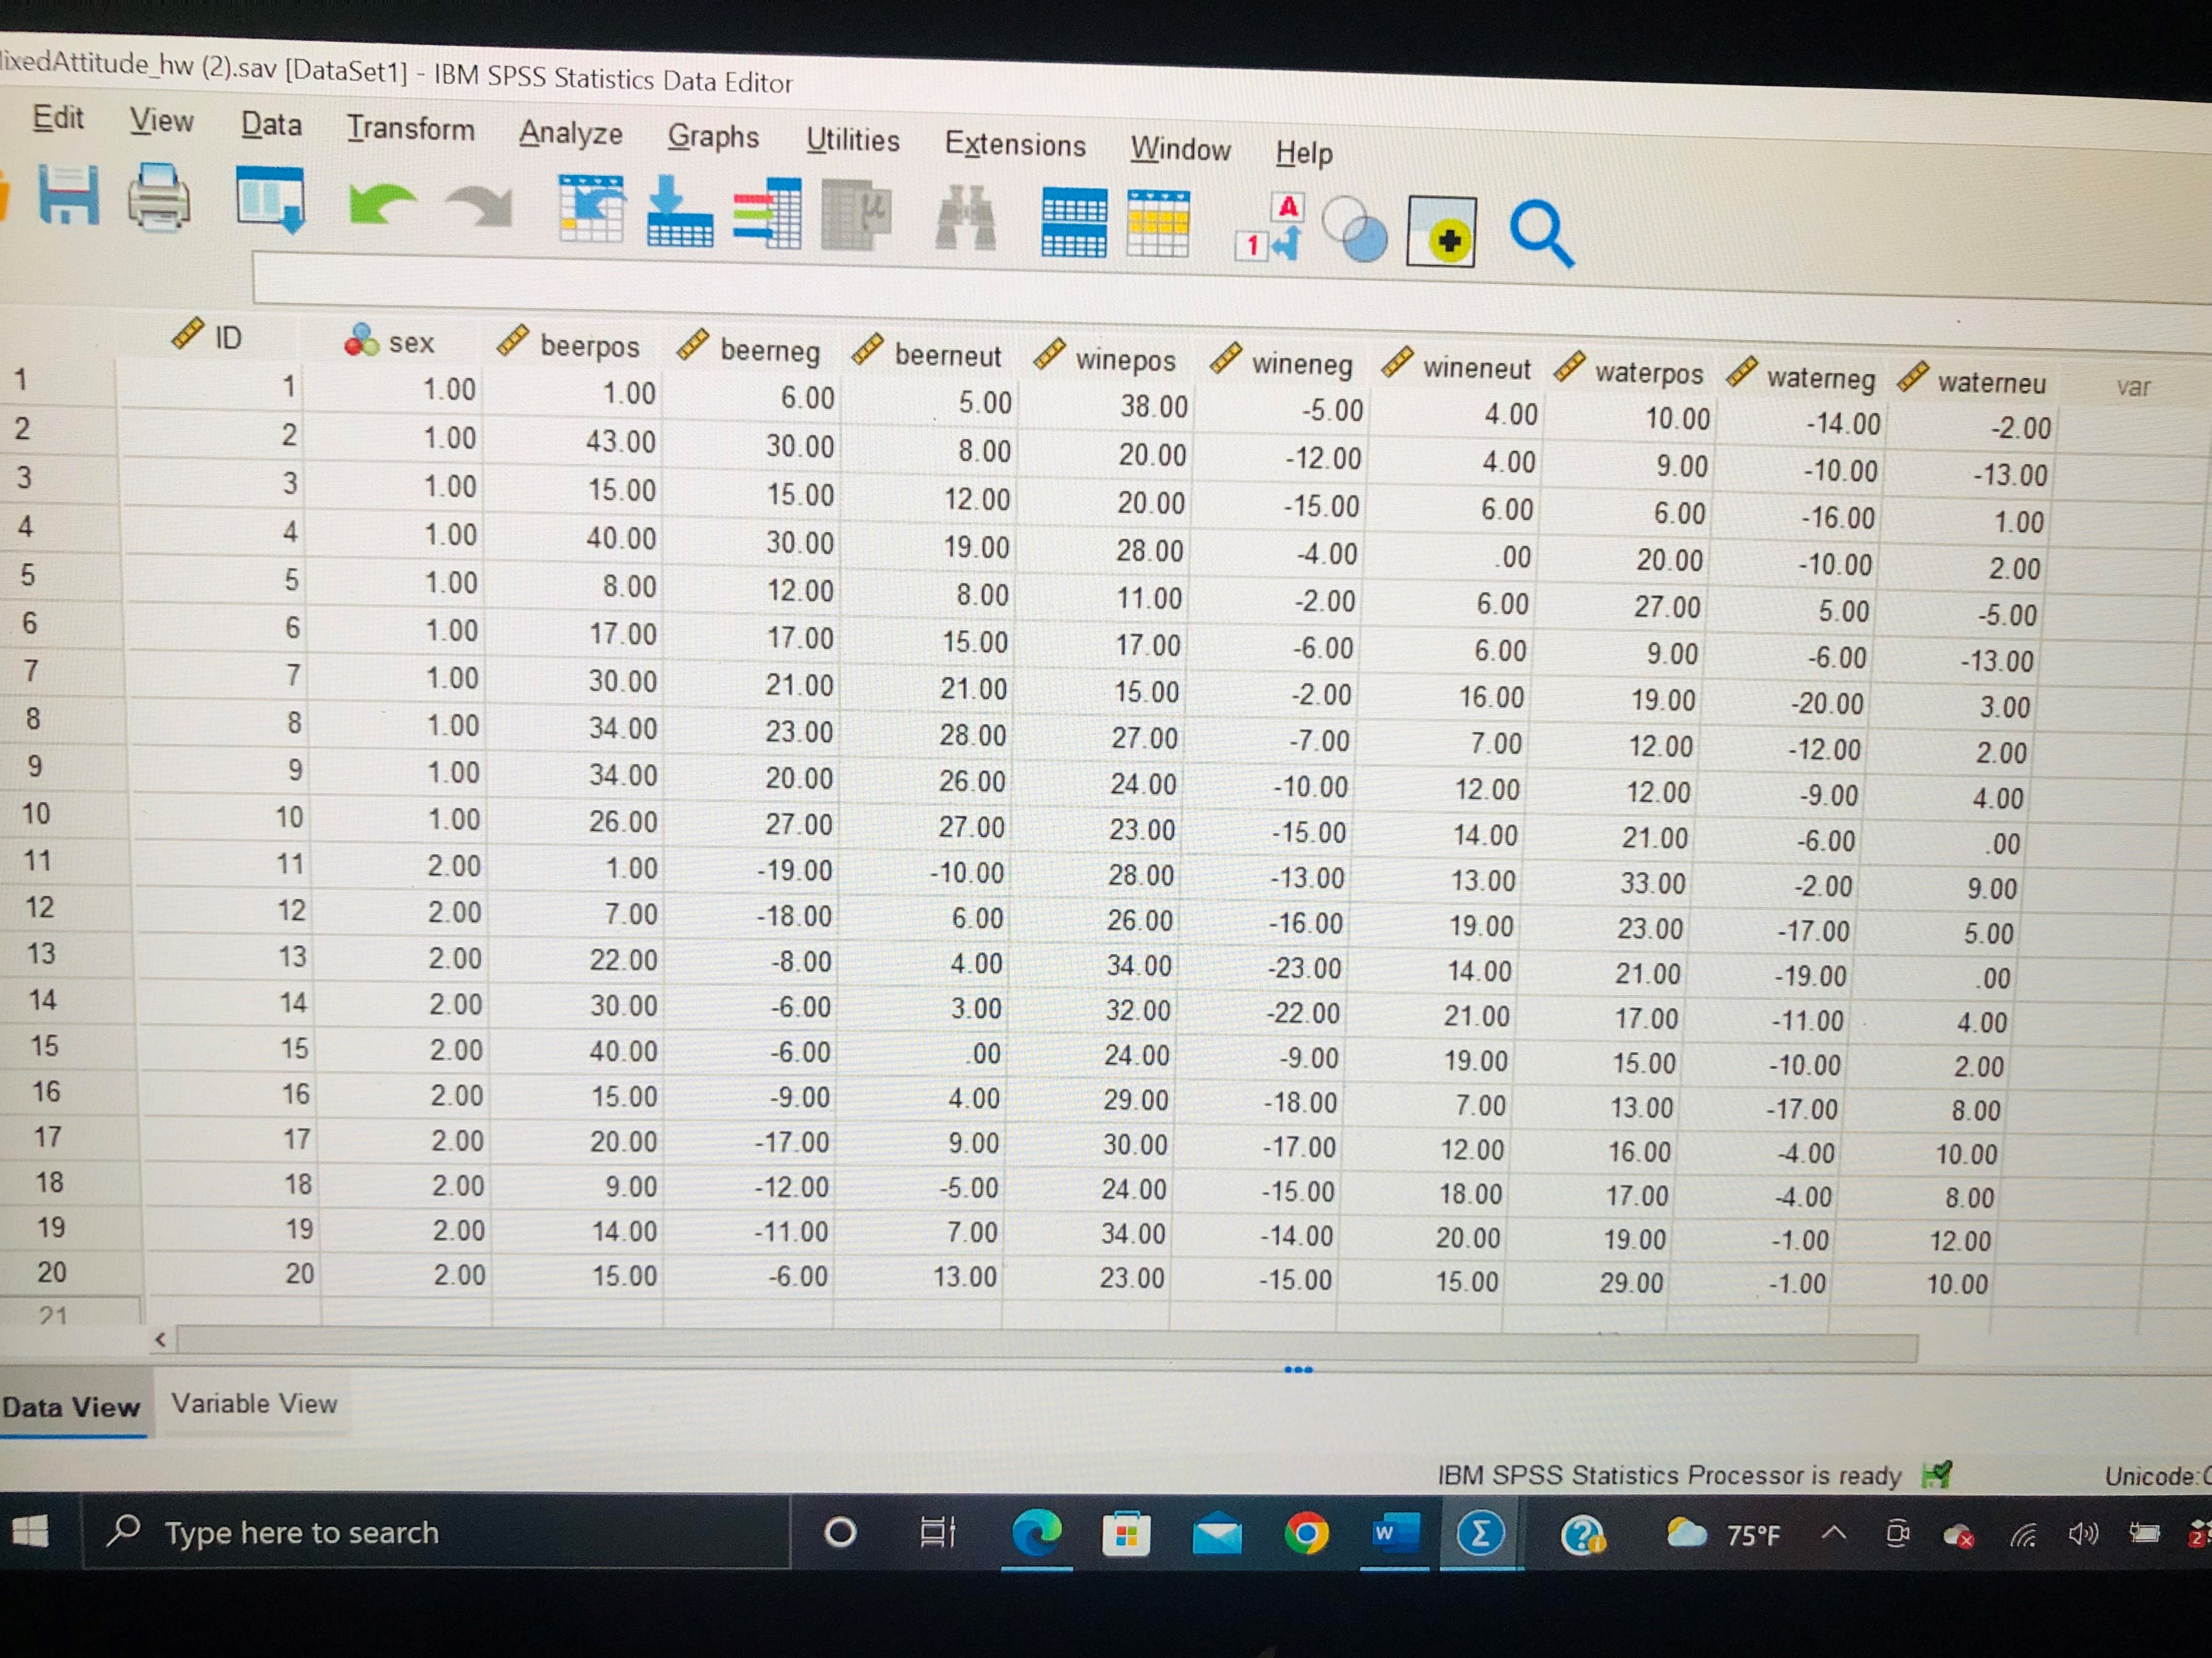
ttitude_hw (2).sav [DataSet1] - IBM SPSS Statistics Data Editor View Data Transform Analyze Graphs Utilities Extensions Window Help Q Name Type Width Decimals Label Values Missing Columns Align Measure Role ID Numeric Co 0 None None 8 Right Scale Input sex Numeric [1.00, Male).. None Right Nominal Input beerpos Numeric 8 NNN Beer + Sexy None None Right Scale Input beerneg Numeric Beer + Corpse None None Right Scale \\ Input Co CO \\ Input beerneut Numeric 2 Beer + Person in Armchair None None Right Scale Input winepos Numeric Wine + Sexy None None Right Scale Wine + Corpse None None 8 Right Scale ~Input wineneg Numeric Right Scale Input wineneut Numeric Wine + Person in Armchair None None NNNNNN Water + Sexy None None Right Scale Input 60 00 00 00 waterpos Numeric None None Right Scale Input Numeric Water + Corpse waterneg Input Numeric Water + Person in Armchair None None Right Scale vaterneu Unicode ON Variable View IBM SPSS Statistics Processor is ready View hs w 75OF searchixedAttitude_hw (2).sav [DataSet1] - IBM SPSS Statistics Data Editor Edit View Data Transform Analyze Graphs Utilities Extensions Window Help H 1 + Q ID sex beerpos beerneg beerneut winepos wineneg wineneut waterpos waterneg waterneu var 1.00 1.00 6.00 5.00 38.00 -5.00 4.00 10.00 -14.00 -2.00 1.00 43.00 30.00 8.00 20.00 -12.00 4.00 9.00 -10.00 -13.00 1.00 15.00 15.00 12.00 20.00 -15.00 5.00 6.00 -16.00 1.00 UI A W N 1.00 40.00 30.00 19.00 28.00 -4.00 00 20.00 -10.00 2.00 O VQ UI A W N 1.00 8.00 12.00 8.00 11.00 -2.00 5.00 27.00 5.00 -5.00 1.00 17.00 17.00 15.00 17 00 .6.00 6.00 9.00 6.00 -13.00 1.00 30.00 21.00 21.00 15.00 2.00 16.00 19.00 -20.00 3.00 8 1.00 34.00 23.00 28.00 27.00 -7.00 7.00 12.00 -12.00 2.00 1.00 34.00 20.00 26.00 24.00 -10.00 12.00 12.00 9.00 4.00 10 1.00 26.00 27.00 27.00 23.00 -15.00 14.00 21.00 -6.00 .00 2.00 1.00 19.00 10.00 28.00 -13.00 13.00 33.00 2.00 9.00 12 2.00 7.00 18.00 6.00 26.00 -16.00 19.00 23.00 -17.00 5.00 13 2.0 22.00 -8.00 4.00 34.00 23.00 14.00 21.00 19.00 00 14 2.00 30.00 6.00 3.00 32.00 -22.00 21.00 17.00 -11.00 4.00 15 2.00 40.00 6.00 00 24.00 -9.00 19.00 15.00 10.00 2.00 16 16 2.0 15.00 9.00 4.00 29.00 -18.00 7.00 13.00 -17.00 8.00 17 17 2.00 20.00 -17.00 9.00 30.00 -17.00 12.00 16.00 4.00 10.00 18 18 2.00 9.00 -12.00 -5.00 24.00 -15.00 18.00 17.00 4.00 8.00 19 19 2.00 14.00 -11.00 7.00 34.00 -14.00 20.00 19.00 -1.00 12.00 20 20 2.00 15.00 -6.00 13.00 23.00 -15.00 15.00 29.00 -1.00 10.00 21 Data View Variable View IBM SPSS Statistics Processor is ready Unicode Type here to search O W 75OF
Step by Step Solution
There are 3 Steps involved in it

Get step-by-step solutions from verified subject matter experts