

Question: Tukey HSD Interpretation Criterion : Interpret Tukey HSD results from SPSS output. Data :Use your output fromProblem Set 4.10.(below) Post Hoc Tests Multiple Comparisons Dependent
Tukey HSD Interpretation
- Criterion: Interpret Tukey HSD results from SPSS output.
- Data:Use your output fromProblem Set 4.10.(below)
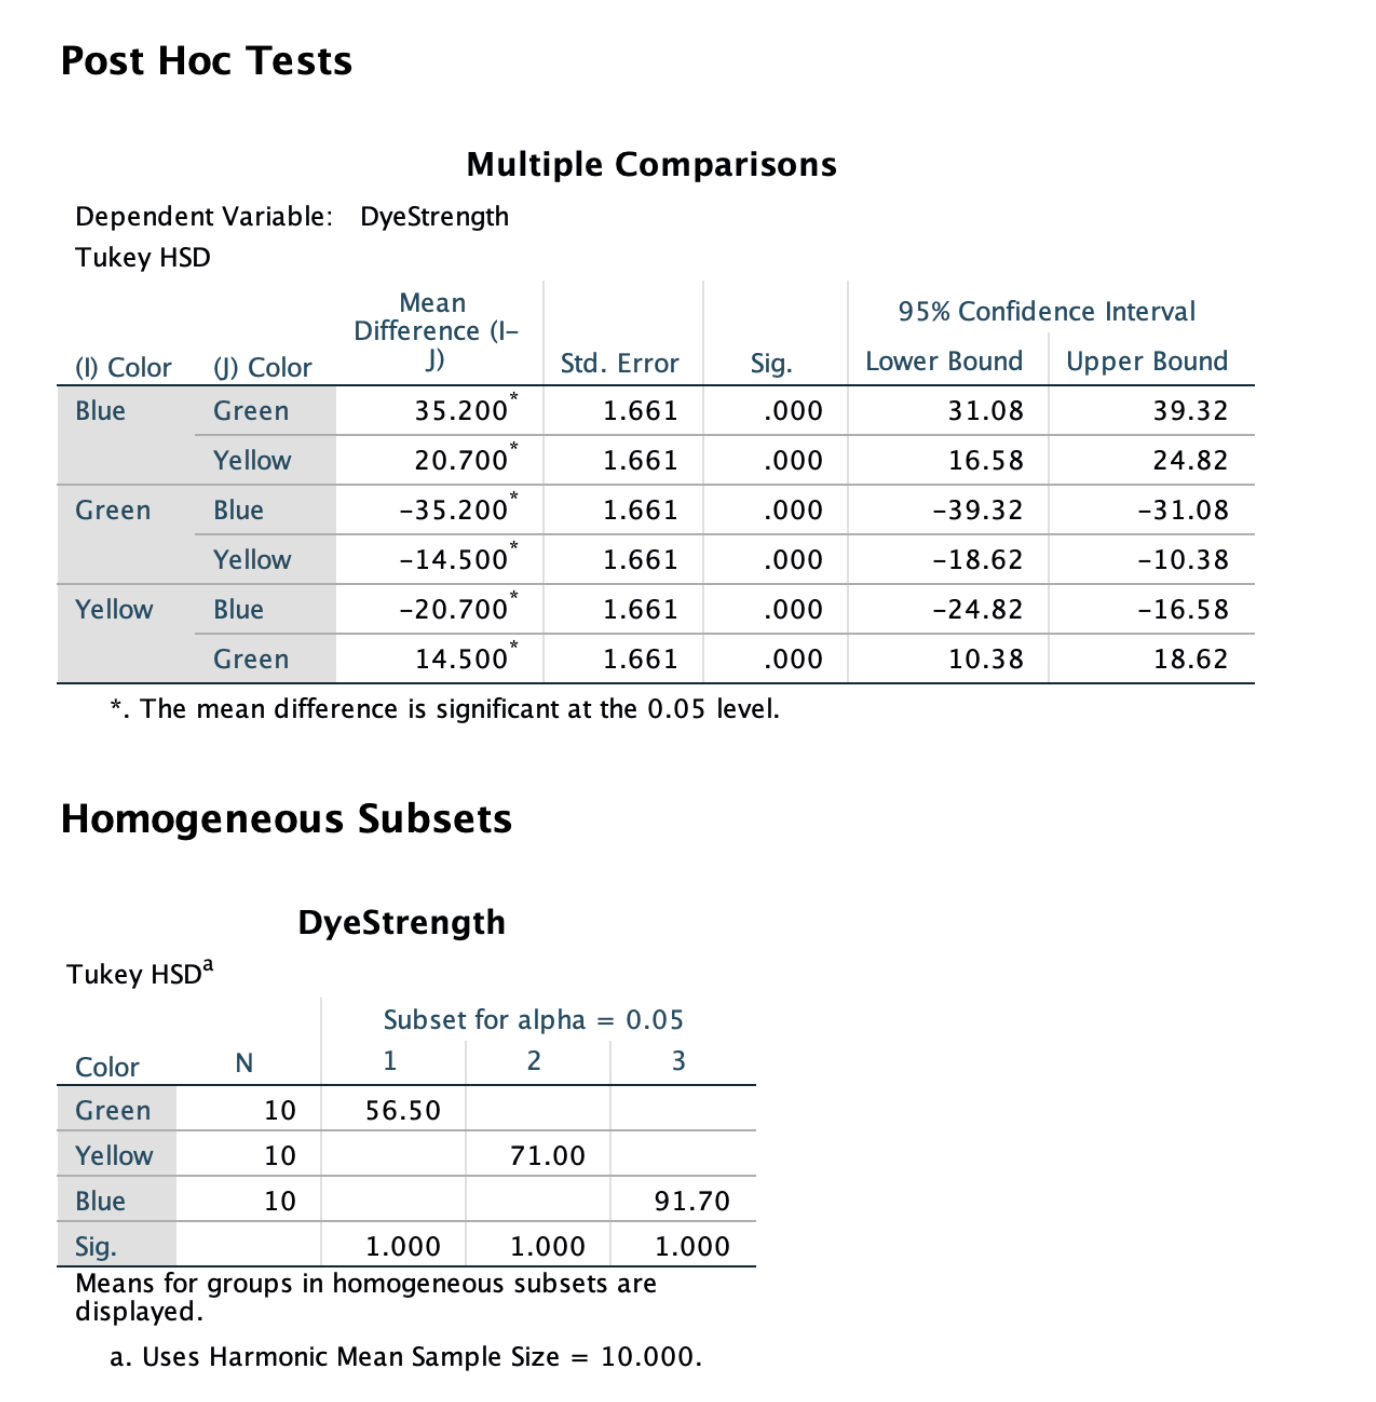
Post Hoc Tests Multiple Comparisons Dependent Variable: DyeStrength Tukey HSD Mean Difference (1- 95% Confidence Interval (1) Color () Color J) Std. Error Sig. Lower Bound Upper Bound Blue Green 35.200 1.661 000 31.08 39.32 Yellow 20.700 1.661 000 16.58 24.82 Green Blue -35.200 1.661 000 -39.32 -31.08 Yellow -14.500 1.661 000 -18.62 -10.38 Yellow Blue -20.700 1.661 000 -24.82 -16.58 Green 14.500 1.661 000 10.38 18.62 *. The mean difference is significant at the 0.05 level. Homogeneous Subsets DyeStrength Tukey HSDa Subset for alpha = 0.05 Color N 1 2 3 Green 10 56.50 Yellow 10 71.00 Blue 10 91.70 Sig. 1.000 1.000 1.000 Means for groups in homogeneous subsets are displayed. a. Uses Harmonic Mean Sample Size = 10.000
Step by Step Solution
There are 3 Steps involved in it

Get step-by-step solutions from verified subject matter experts