

Question: Turn the attached table into a visualization that would be used to brief senior decision makers. This table contains the number of soldiers has gained
Turn the attached table into a visualization that would be used to brief senior decision makers. This table contains the number of soldiers has gained and lost over the last seven fiscal years in addition to the projections for the next five. The goal is to depict the trends over time of accessions and losses of reserve members in relation to the sources of those gains and losses.
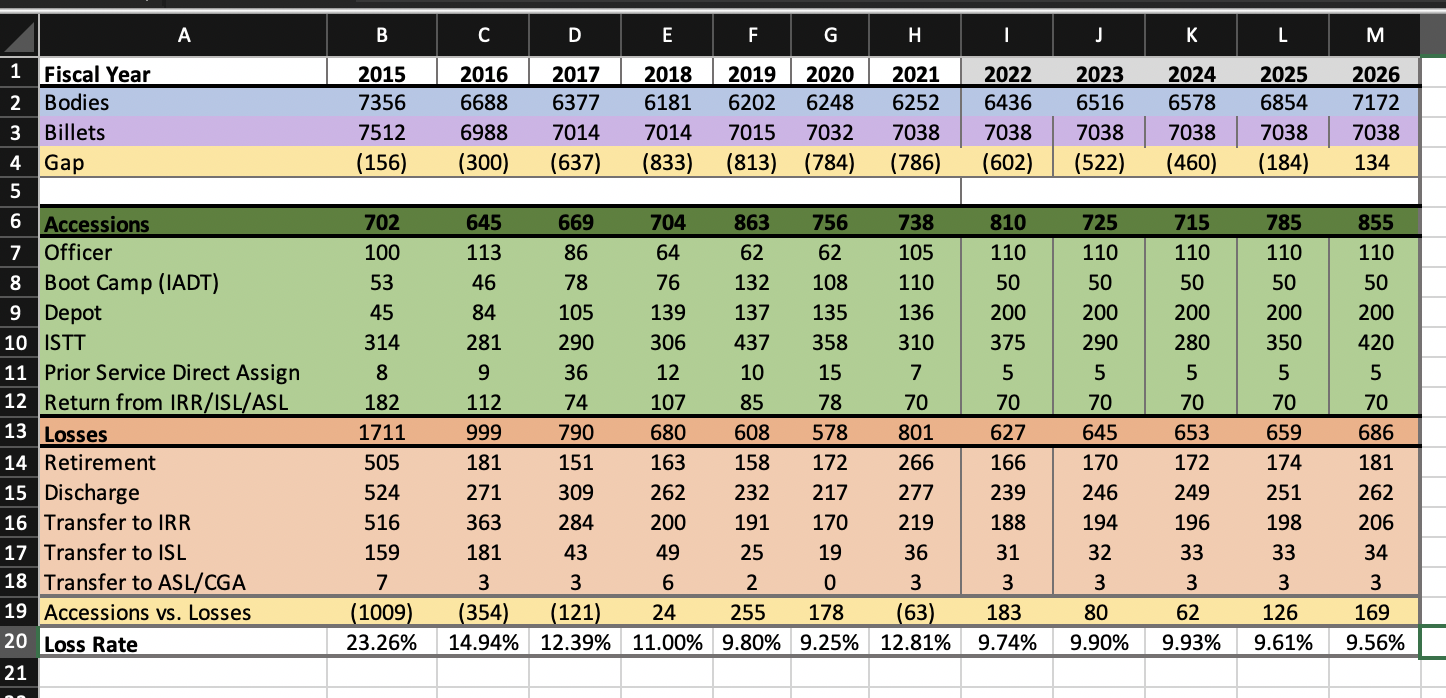
A B D E F G I J K L M 2015 7356 7512 (156) 2016 6688 6988 (300) 2017 6377 7014 (637) 2018 6181 7014 (833) 2019 6202 7015 (813) 2020 6248 7032 (784) 2021 6252 7038 (786) 2022 6436 7038 (602) 2023 2024 6516 6578 7038 7038 (522) (460) 2025 6854 7038 (184) 2026 7172 7038 134 725 110 50 200 290 715 110 50 855 110 50 200 420 200 1 Fiscal Year 2 Bodies 3 Billets 4 Gap 5 6 Accessions 7 Officer 8 Boot Camp (IADT) 9 Depot 10 ISTT 11 Prior Service Direct Assign 12 Return from IRR/ISL/ASL 13 Losses 14 Retirement 15 Discharge 16 Transfer to IRR 17 Transfer to ISL 18 Transfer to ASL/CGA 19 Accessions vs. Losses 20 Loss Rate 21 702 100 53 45 314 8 182 1711 505 524 516 159 7 (1009). 23.26% 645 669 704 863 756 738 113 86 64 62 62 105 46 78 76 132 108 110 84 105 139 137 135 136 281 290 306 437 358 310 9 36 12 10 15 7 112 74 107 85 78 70 999 790 680 608 578 801 81 151 163 158 271 309 262 232 217 277 363 284 200 191 170 219 181 43 49 25 19 36 3 3 6 2 0 3 (354) (121) 24 255 178 (63) 14.94% 12.39% 11.00% 9.80% 9.25% 12.81% 810 110 50 200 375 5 70 627 166 239 188 31 3 183 9.74% 785 110 50 200 350 5 70 659 74 5 70 686 5 70 645 170 246 194 32 280 5 70 653 172 249 196 33 3 62 9.93% 251 198 33 262 206 34 3 3 80 9.90% 3 126 9.61% 169 9.56%
Step by Step Solution
There are 3 Steps involved in it

Get step-by-step solutions from verified subject matter experts