

Question: TUTORIAL #7: LINEAR REGRESSION ID: PROBLEM 1 Name: The table below show data collected in an experiment. The results are also shown on a graph.
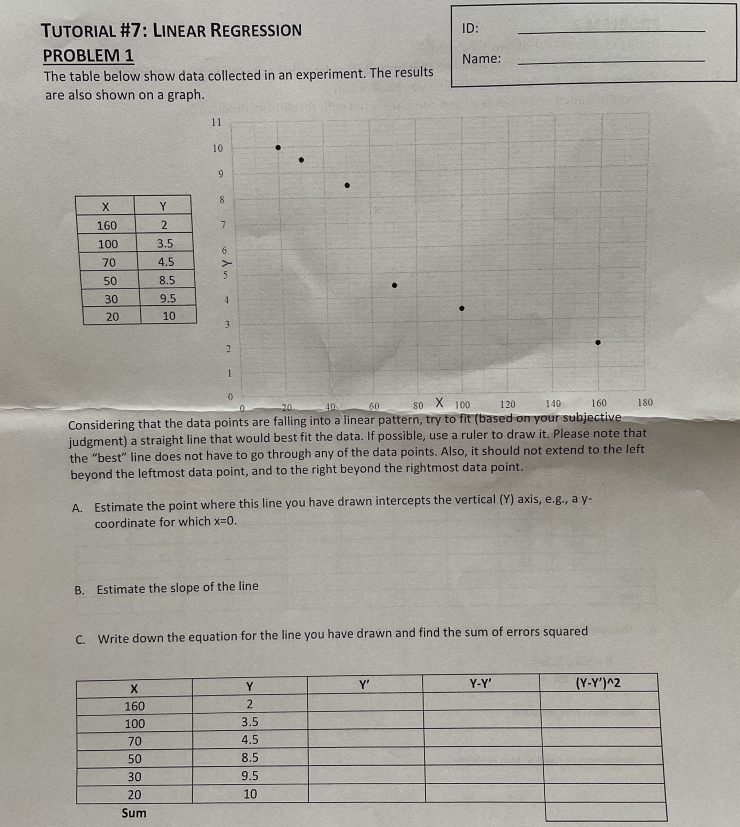
TUTORIAL #7: LINEAR REGRESSION ID: PROBLEM 1 Name: The table below show data collected in an experiment. The results are also shown on a graph. 11 10 X Y 160 2 7 100 3.5 70 4.5 50 8.5 30 9.5 20 10 60 80 X 100 120 140 160 180 Considering that the data points are falling into a linear pattern, try to fit (based on your subjective judgment) a straight line that would best fit the data. If possible, use a ruler to draw it. Please note that the "best" line does not have to go through any of the data points. Also, it should not extend to the left beyond the leftmost data point, and to the right beyond the rightmost data point. A. Estimate the point where this line you have drawn intercepts the vertical (Y) axis, e.g., a y- coordinate for which *=0. B. Estimate the slope of the line C. Write down the equation for the line you have drawn and find the sum of errors squared X Y Y' Y-Y' (Y-Y')^2 160 2 100 3.5 70 4.5 50 8.5 30 9.5 20 10 Sum
Step by Step Solution
There are 3 Steps involved in it

Get step-by-step solutions from verified subject matter experts