

Question: Tutorial Environment History Connections Import Dataset List Global Environment values Y num [1:20] 60 49 62 41 50 45 47 43 44 58 num [1:14]
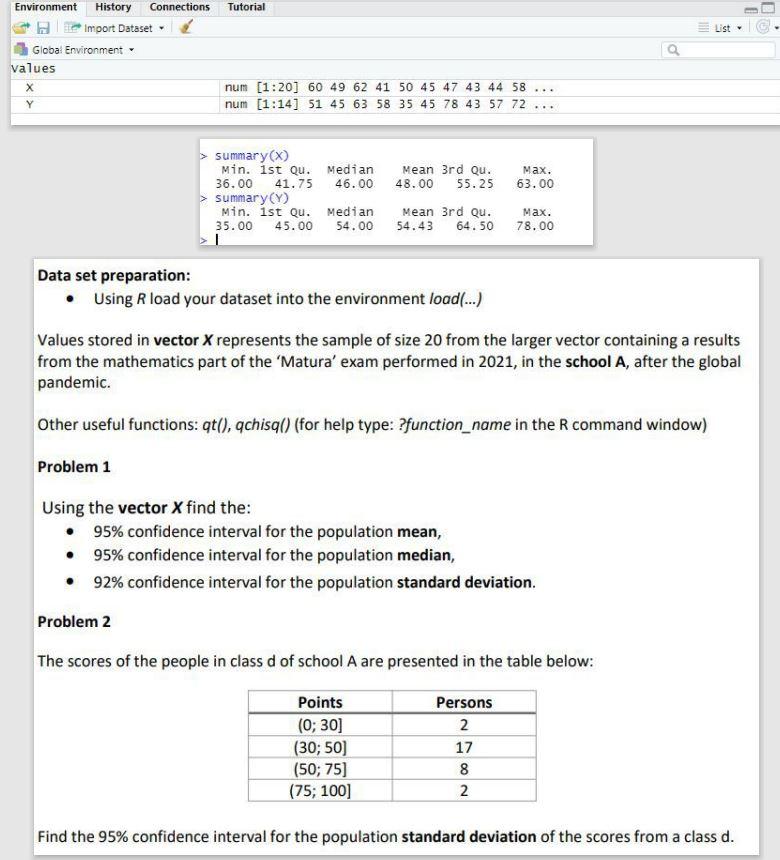
Tutorial Environment History Connections Import Dataset List Global Environment values Y num [1:20] 60 49 62 41 50 45 47 43 44 58 num [1:14] 51 45 63 58 35 45 78 43 57 72 . Mean 3rd Qu. 48.00 55.25 Max. 63.00 summary(x) Min. 1st Qu. Median 36.00 41.75 46.00 > Summary() Min. 1st Qu. Median 35.00 45.00 54.00 Mean 3rd Qu. Max. 54.43 64.50 78.00 Data set preparation: Using R load your dataset into the environment load(...) Values stored in vector X represents the sample of size 20 from the larger vector containing a results from the mathematics part of the 'Matura' exam performed in 2021, in the school A, after the global pandemic. Other useful functions: qt(), qchisq() (for help type: ?function_name in the command window) Problem 1 Using the vector X find the: 95% confidence interval for the population mean, 95% confidence interval for the population median, 92% confidence interval for the population standard deviation. Problem 2 The scores of the people in class d of school A are presented in the table below: Points (0; 30] (30; 50) (50; 75) (75; 100) Persons 2. 17 8 2 Find the 95% confidence interval for the population standard deviation of the scores from a class d. Tutorial Environment History Connections Import Dataset List Global Environment values Y num [1:20] 60 49 62 41 50 45 47 43 44 58 num [1:14] 51 45 63 58 35 45 78 43 57 72 . Mean 3rd Qu. 48.00 55.25 Max. 63.00 summary(x) Min. 1st Qu. Median 36.00 41.75 46.00 > Summary() Min. 1st Qu. Median 35.00 45.00 54.00 Mean 3rd Qu. Max. 54.43 64.50 78.00 Data set preparation: Using R load your dataset into the environment load(...) Values stored in vector X represents the sample of size 20 from the larger vector containing a results from the mathematics part of the 'Matura' exam performed in 2021, in the school A, after the global pandemic. Other useful functions: qt(), qchisq() (for help type: ?function_name in the command window) Problem 1 Using the vector X find the: 95% confidence interval for the population mean, 95% confidence interval for the population median, 92% confidence interval for the population standard deviation. Problem 2 The scores of the people in class d of school A are presented in the table below: Points (0; 30] (30; 50) (50; 75) (75; 100) Persons 2. 17 8 2 Find the 95% confidence interval for the population standard deviation of the scores from a class d
Step by Step Solution
There are 3 Steps involved in it

Get step-by-step solutions from verified subject matter experts