

Question: Tutorial Exercise You may need to use the appropriate technology to answer this question. Test the following hypotheses by using the y' goodness of fit
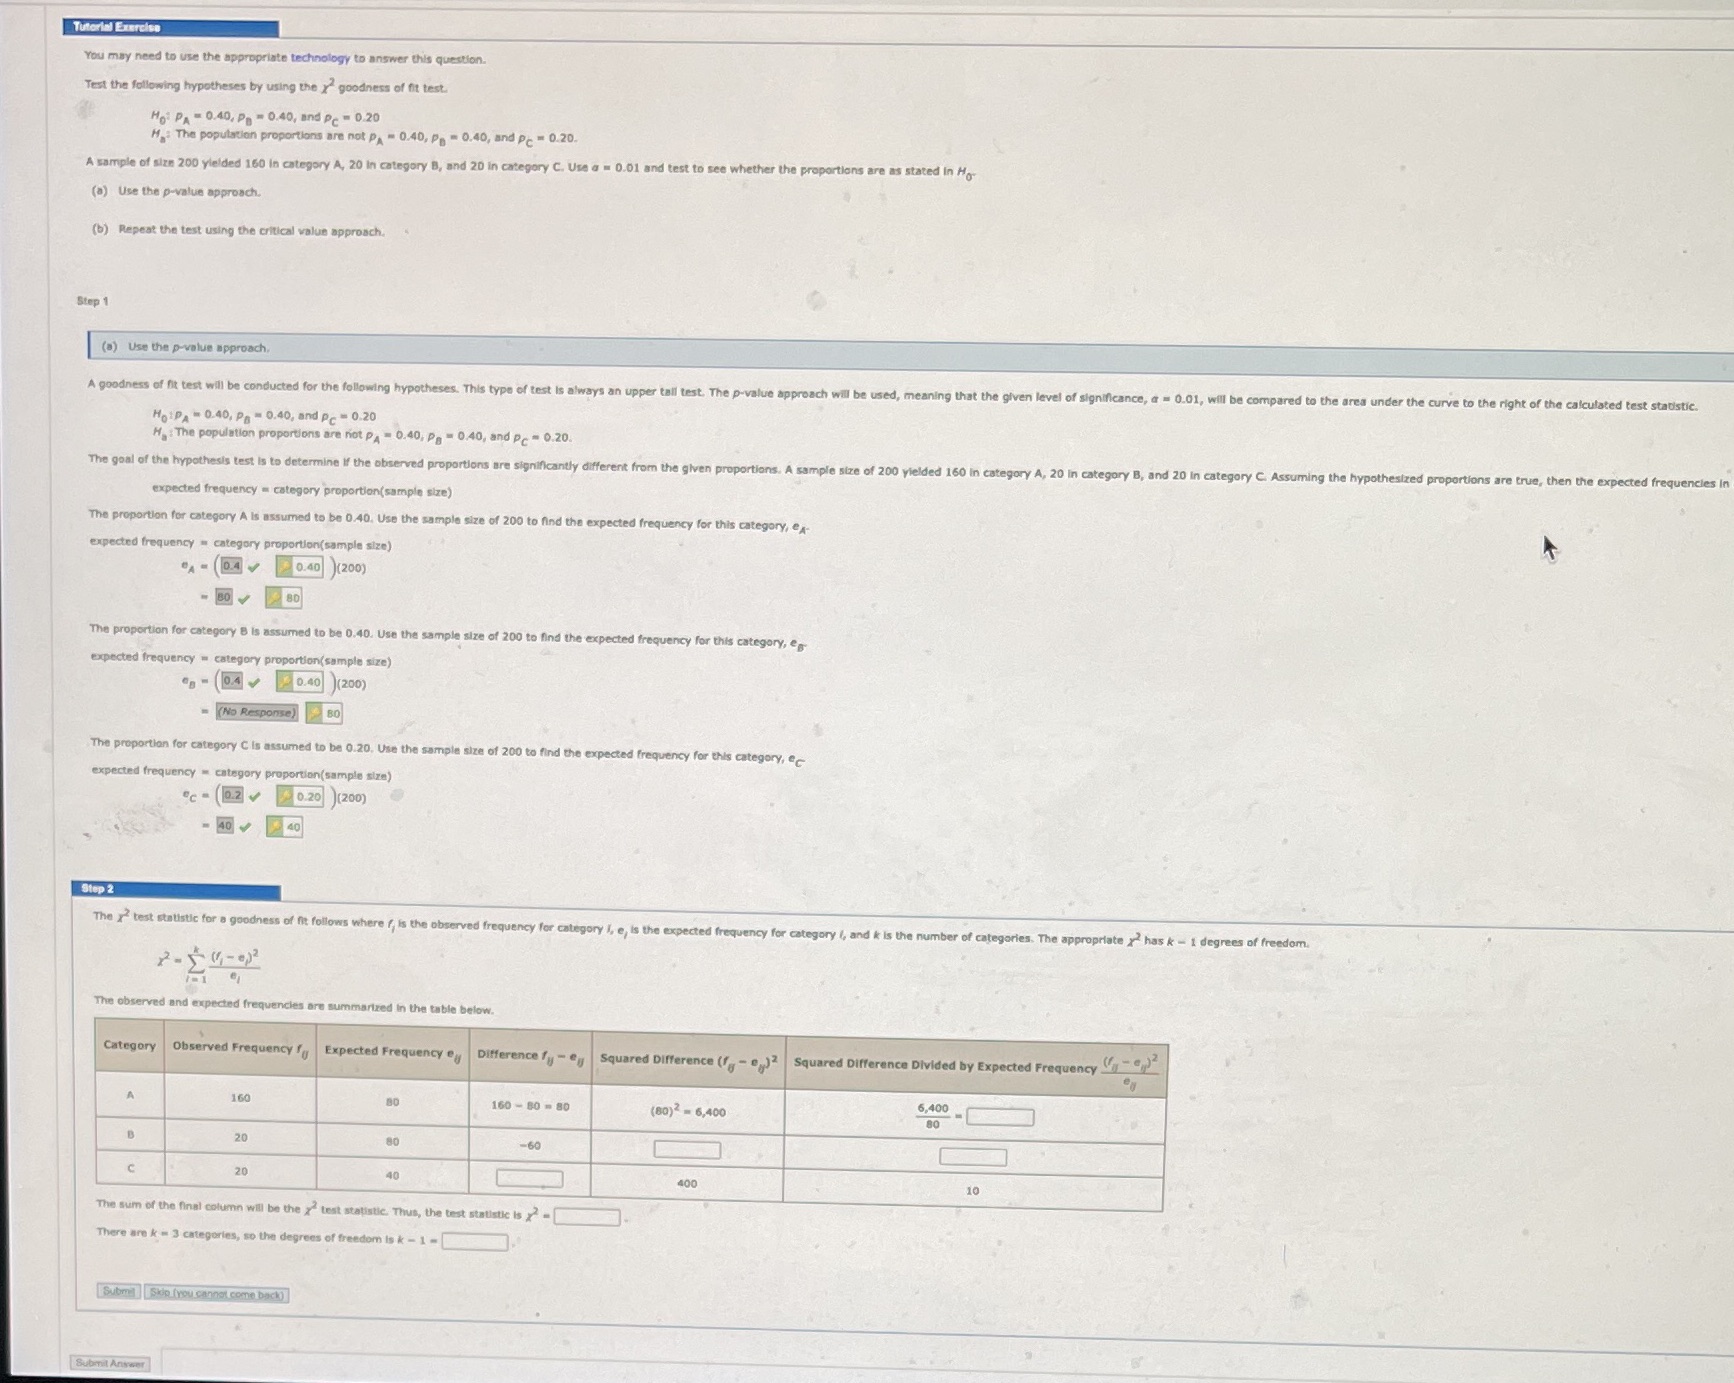
Tutorial Exercise You may need to use the appropriate technology to answer this question. Test the following hypotheses by using the y' goodness of fit test. Hot PA = 0.40, Pp - 0.40, and Pc = 0.20 H: The population proportions are not PA - 0.40, Pp - 0.40, and Pc = 0.20. A sample of size 200 yielded 160 in category A, 20 in category B, and 20 in category C. Use a = 0.01 and test to see whether the proportions are as stated in Ho (a) Use the p-value approach. (b) Repeat the test using the critical value approach. Step () Use the p-value approach. Agoodness of fit test will be conducted for the following hypotheses. This type of test is always an upper tall test. The p-value approach will be used, mea ning that the given level of significance, a = 0.01, will be compared to the area under the curve to the right of the calculated test statistic. HotPA = 0.40, Pa = 0.40, and Pc = 0.20 He: The population proportions are not PA = 0.40, P. = 0.40, and Pc = 0.20. The goal of the hypothesis test Is to determine d proportions are significantly different from the given proporti ins. A sample size of 200 vielded 160 in category A, 20 in category B, and 20 in category C. Assuming the hypothesized proportions are true, then the expected frequencies I expected frequency = category proportion(sample size) The proportion for category A is assumed to be 0.40. Use the sample size of 200 to find the expected frequency for this category, ex- expected frequency = category proportion(sample size) A = 0.4 7 0.40 (200) The proportion for category B is assumed to be 0.40. Use the sample size of 200 to find the expected frequency for this category, es expected frequency = category proportion(sample size) "B - 0.4 0.40 (200) (No Response) 80 The proportion for category C Is assumed to be 0.20. Use the sample size of 200 to find the expected frequency for this category, ec expected frequency = category proportion(sample size) "c = 0.2 4 0.20 (200) - 40 40 Step 2 The x test statistic for a goodness of hit follows where f, is the observed or category I, e, is the expected frequency for category (, and & is the number of categories. The appropriate x has k - 1 degrees of freedom. The observed and exper ted frequencies nmarized in the table below Category Observed Frequency / Expected Frequency ey Difference fy - ey Squared Difference (fg - cy) |Squared Difference Divided by Expected Frequency -1) 160 160 - 80 - 80 (80)2 - 6,400 6,400 20 80 20 40 400 10 The sum of the final column will be the y? test statistic. Thus, the test statistic is x- There are k # 3 categories, so the degrees Submal Skip (you.cannot come back) Submil
Step by Step Solution
There are 3 Steps involved in it

Get step-by-step solutions from verified subject matter experts