

Question: Two charts are shown below. The upper chart (from the Business Insider website) shows the S&P500 index level during the financial crisis. As shown on
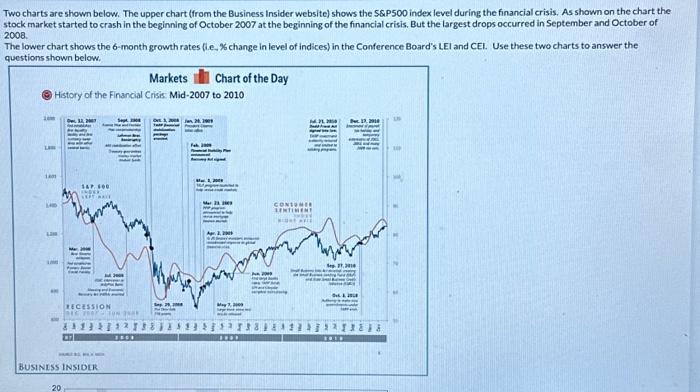
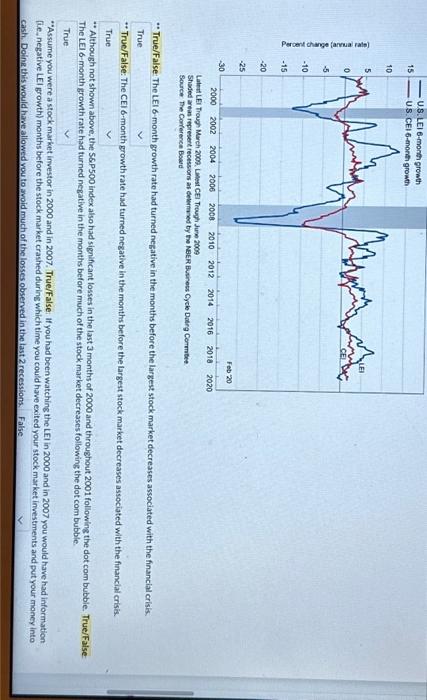
Two charts are shown below. The upper chart (from the Business Insider website) shows the S\&PSOO index level during the financial crisis. As shown on the chart the stock market started to crash in the beginning of October 2007 at the beginning of the financial crisis. But the largest drops occurred in September and October of 2008. The lower chart shows the 6-month growth rates (i.e.\% change in level of indices) in the Conference Board's LEI and CEL. Use these two charts to answer the Source the Corference Bowed -True/False: The LEI 6-month growth rate had turned negative in the months before the largest stock market decreases associated with the financial crisis. *True/False: The CEI 6-month growth rate had turned negative in the months before the largest stock market decreases associated with the financial crisis. *Although not shown above, the S6P500 index also had significant losses in the last 3 months of 2000 and throughout 2001 following the dot com bubble. True/Faise: The LEl 6-month growth rate had turned negative in the months before much of the stock market decreases following the dot com bubble. "Assume you were a stock market imvestor in 2000 and in 2007. True/False: If you had been watching the LEl in 2000 and in 2007 you would have had information [i.e, negative LEl growth) months before the stock market crashed during which time you could have exited your stock market investments and put your money into cash. Dolne this would hawe allowed vou to avoid much of the losses observed in the last 2 recessions. False
Step by Step Solution
There are 3 Steps involved in it

Get step-by-step solutions from verified subject matter experts