

Question: Two drinking water samples from Walkerton were collected on two consecutive days to investigate for possible agricultural run-off contamination of nitrite after a major
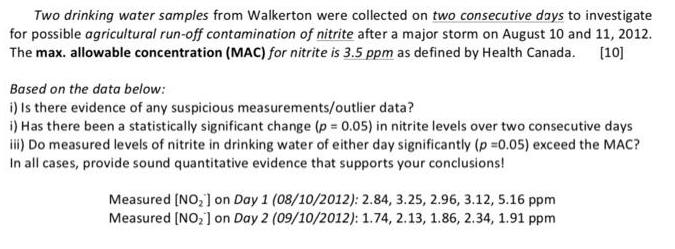
Two drinking water samples from Walkerton were collected on two consecutive days to investigate for possible agricultural run-off contamination of nitrite after a major storm on August 10 and 11, 2012. The max. allowable concentration (MAC) for nitrite is 3.5 ppm as defined by Health Canada. [10] Based on the data below: i) Is there evidence of any suspicious measurements/outlier data? i) Has there been a statistically significant change (p 0.05) in nitrite levels over two consecutive days iii) Do measured levels of nitrite in drinking water of either day significantly (p =0.05) exceed the MAC? In all cases, provide sound quantitative evidence that supports your conclusions! Measured (NO, ] on Day 1 (08/10/2012): 2.84, 3.25, 2.96, 3.12, 5.16 ppm Measured [NO,] on Day 2 (09/10/2012): 1.74, 2.13, 1.86, 2.34, 1.91 ppm
Step by Step Solution
3.50 Rating (160 Votes )
There are 3 Steps involved in it
There is one outlier in Day 1 dataset ii The hypothesis being tested is H 0 1 2 H 1 1 2 Day 1 Day 2 ... View full answer

Get step-by-step solutions from verified subject matter experts