

Question: Two laboratory compaction curves ( A and B ) for the same soil using different compaction efforts are given in Fig. ( 1 ) Which
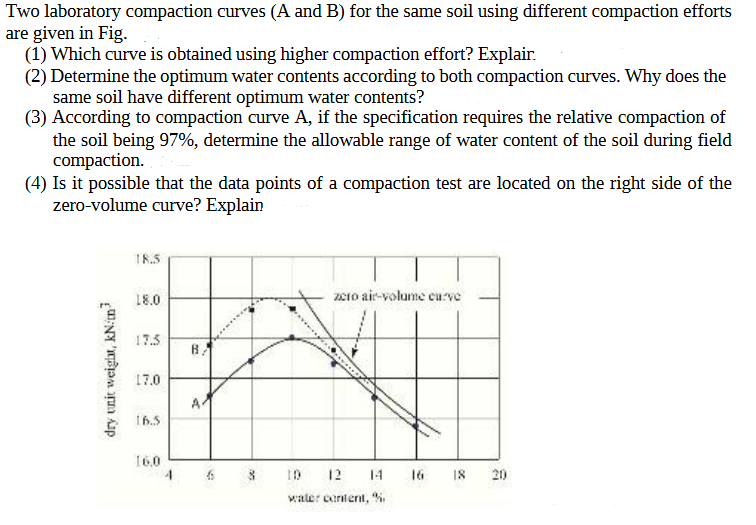
Two laboratory compaction curves A and B for the same soil using different compaction efforts are given in Fig.
Which curve is obtained using higher compaction effort? Explair.
Determine the optimum water contents according to both compaction curves. Why does the same soil have different optimum water contents?
According to compaction curve A if the specification requires the relative compaction of the soil being determine the allowable range of water content of the soil during field compaction.
Is it possible that the data points of a compaction test are located on the right side of the zerovolume curve? Explain
Step by Step Solution
There are 3 Steps involved in it
1 Expert Approved Answer
Step: 1 Unlock

Question Has Been Solved by an Expert!
Get step-by-step solutions from verified subject matter experts
Step: 2 Unlock
Step: 3 Unlock