

Question: Two researchers conducted d a study in which two groups of students were asked to answer 42 trivia questions from a board game. The students
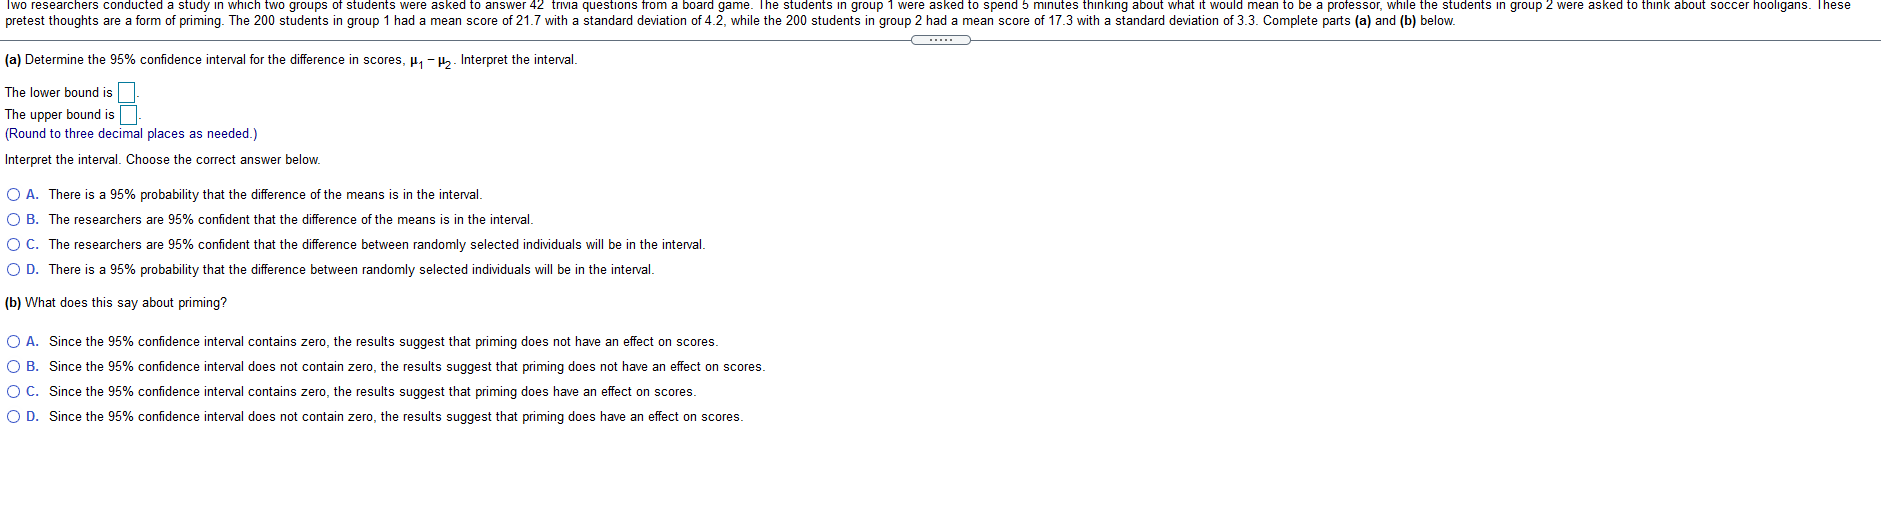
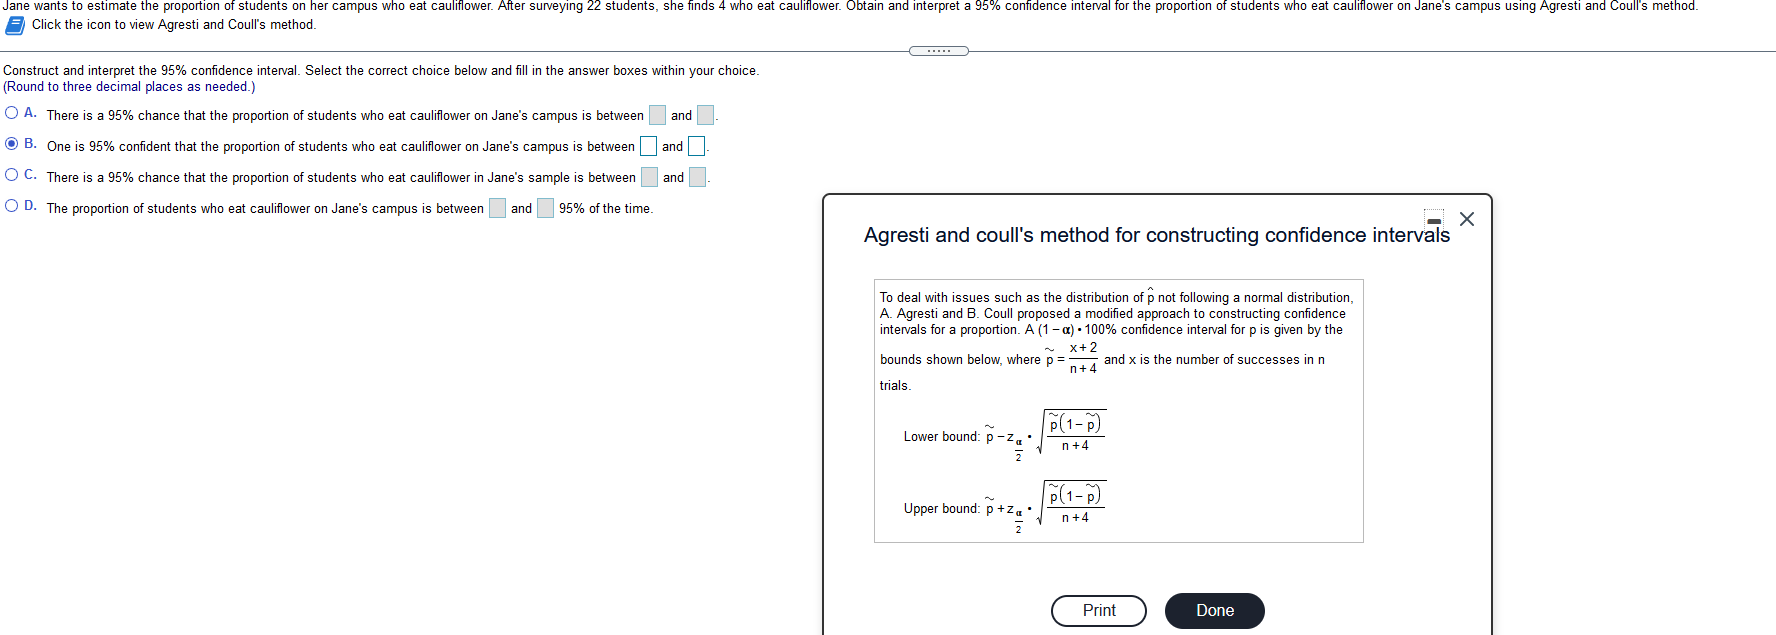
Two researchers conducted d a study in which two groups of students were asked to answer 42 trivia questions from a board game. The students in group 1 were asked to spend 5 minutes thinking about what it would mean to be a professor, while the students in group 2 w These pretest thoughts are a form of priming. The 200 students in group 1 had a mean score of 21.7 with a standard deviation of 4.2, while the 200 students in group 2 had a mean score of 17.3 with a standard deviation of 3.3. Complete parts (a) and (b) below. (a) Determine the 95% confidence interval for the difference in scores, H, - H2- Interpret the interval. The lower bound is The upper bound is (Round to three decimal places as needed.) Interpret the interval. Choose the correct answer below. O A. There is a 95% probability that the difference of the means is in the interval. O B. The researchers are 95% confident that the difference of the means is in the interval. O C. The researchers are 95% confident that the difference between randomly selected individuals will be in the interval. O D. There is a 95% probability that the difference between randomly selected individuals will be in the interval. (b) What does this say about priming? O A. Since the 95% confidence interval contains zero, the results suggest that priming does not have an effect on scores. O B. Since the 95% confidence interval does not contain zero, the results suggest that priming does not have an effect on scores. O C. Since the 95% confidence interval contains zero, the results suggest that priming does have an effect on scores. O D. Since the 95% confidence interval does not contain zero, the results suggest that priming does have an effect on scores.Jane wants to estimate the proportion of students on her campus who eat cauliflower. After surveying 22 students, she finds 4 who eat cauliflower. Obtain and interpret a 95% confidence interval for the proportion of students who eat cauliflower on Jane's campus using Agresti and Coull's method. Click the icon to view Agresti and Coull's method. Construct and interpret the 95% confidence interval. Select the correct choice below and fill in the answer boxes within your choice. (Round to three decimal places as needed.) A. There is a 95% chance that the proportion of students who eat cauliflower on Jane's campus is between and O B. One is 95% confident that the proportion of students who eat cauliflower on Jane's campus is between ]and ]. O C. There is a 95% chance that the proportion of students who eat cauliflower in Jane's sample is between and. O D. The proportion of students who eat cauliflower on Jane's campus is between | | and |95% of the time. X Agresti and coull's method for constructing confidence intervals To deal with issues such as the distribution of p not following a normal distribution, A. Agresti and B. Coull proposed a modified approach to constructing confidence intervals for a proportion. A (1 -() . 100% confidence interval for p is given by the bounds shown below, where p = ~_ x+ 2 n+ 4 and x is the number of successes in n trials. P (1 - P) Lower bound: p - za n+4 Upper bound: p + za " p (1- p) n+4 Print Done
Step by Step Solution
There are 3 Steps involved in it

Get step-by-step solutions from verified subject matter experts