

Question: Type here to 6) Hand-calculater using the computational formula that uses sums of squares (not the one that uses the obtained For obtained 1) SHOW
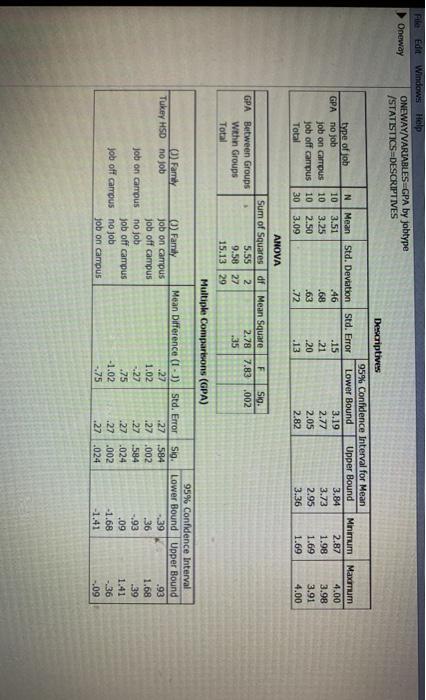
Type here to 6) Hand-calculater using the computational formula that uses sums of squares (not the one that uses the obtained For obtained 1) SHOW YOUR WORK, How would you characterize this effect (1.e. small, medium, large, or somewhere in between two of these qualifiers)? In words, what does this family of effect sizes tell you (big hint: this should be answered by referencing proportion of some form of variance as a factor of something else)? **Do NOT use the effect size provided by software. This is "partial-eta-squared," which does not always match nfor reasons outside the scope of this class. File Edit Windows Help Oneway ONEWAY/VARIABLES GPA by jobtype /STATISTICS=DESCRIPTIVES Descriptives 95% Confidence Interval for Mean type of job N Mean Std. Deviation Std. Error Lower Bound Upper Bound GPA no job 10 3.51 46 .15 3.19 3.84 job on campus 10 3.25 .68 .21 2.77 3.73 Job off campus 10 2.50 .63 .20 2.05 2.95 Total 30 3.09 .72 .13 2.82 3.36 Minimum Maxmum 2.87 4.00 1.98 3.98 1.69 3.91 1.69 4.00 GPA Between Groups Within Groups Total ANOVA Sum of Squares df Mean Square F Sig. 5.55 2 2.78 7.83.002 9.58 27 .35 15.13 29 Multiple Comparisons (GPA) 95% Confidence Interval Family O Family Mean Difference (1) Std. Error Sig. Lower Bound Upper Bound Tukey HSD no job job on campus 27 .27 .584 -39 .93 job off campus 1.02 .27 .002 .36 1.68 job on campus no job 27 .27 584 -93 39 job off campus .75 .27 .024 .09 1.41 Job off campus no job -1.02 .27 .002 -1.68 -.36 job on campus -.75 .27 .024 -1.41 -09 Type here to 6) Hand-calculater using the computational formula that uses sums of squares (not the one that uses the obtained For obtained 1) SHOW YOUR WORK, How would you characterize this effect (1.e. small, medium, large, or somewhere in between two of these qualifiers)? In words, what does this family of effect sizes tell you (big hint: this should be answered by referencing proportion of some form of variance as a factor of something else)? **Do NOT use the effect size provided by software. This is "partial-eta-squared," which does not always match nfor reasons outside the scope of this class. File Edit Windows Help Oneway ONEWAY/VARIABLES GPA by jobtype /STATISTICS=DESCRIPTIVES Descriptives 95% Confidence Interval for Mean type of job N Mean Std. Deviation Std. Error Lower Bound Upper Bound GPA no job 10 3.51 46 .15 3.19 3.84 job on campus 10 3.25 .68 .21 2.77 3.73 Job off campus 10 2.50 .63 .20 2.05 2.95 Total 30 3.09 .72 .13 2.82 3.36 Minimum Maxmum 2.87 4.00 1.98 3.98 1.69 3.91 1.69 4.00 GPA Between Groups Within Groups Total ANOVA Sum of Squares df Mean Square F Sig. 5.55 2 2.78 7.83.002 9.58 27 .35 15.13 29 Multiple Comparisons (GPA) 95% Confidence Interval Family O Family Mean Difference (1) Std. Error Sig. Lower Bound Upper Bound Tukey HSD no job job on campus 27 .27 .584 -39 .93 job off campus 1.02 .27 .002 .36 1.68 job on campus no job 27 .27 584 -93 39 job off campus .75 .27 .024 .09 1.41 Job off campus no job -1.02 .27 .002 -1.68 -.36 job on campus -.75 .27 .024 -1.41 -09
Step by Step Solution
There are 3 Steps involved in it

Get step-by-step solutions from verified subject matter experts